Fig. 12.
Download original image
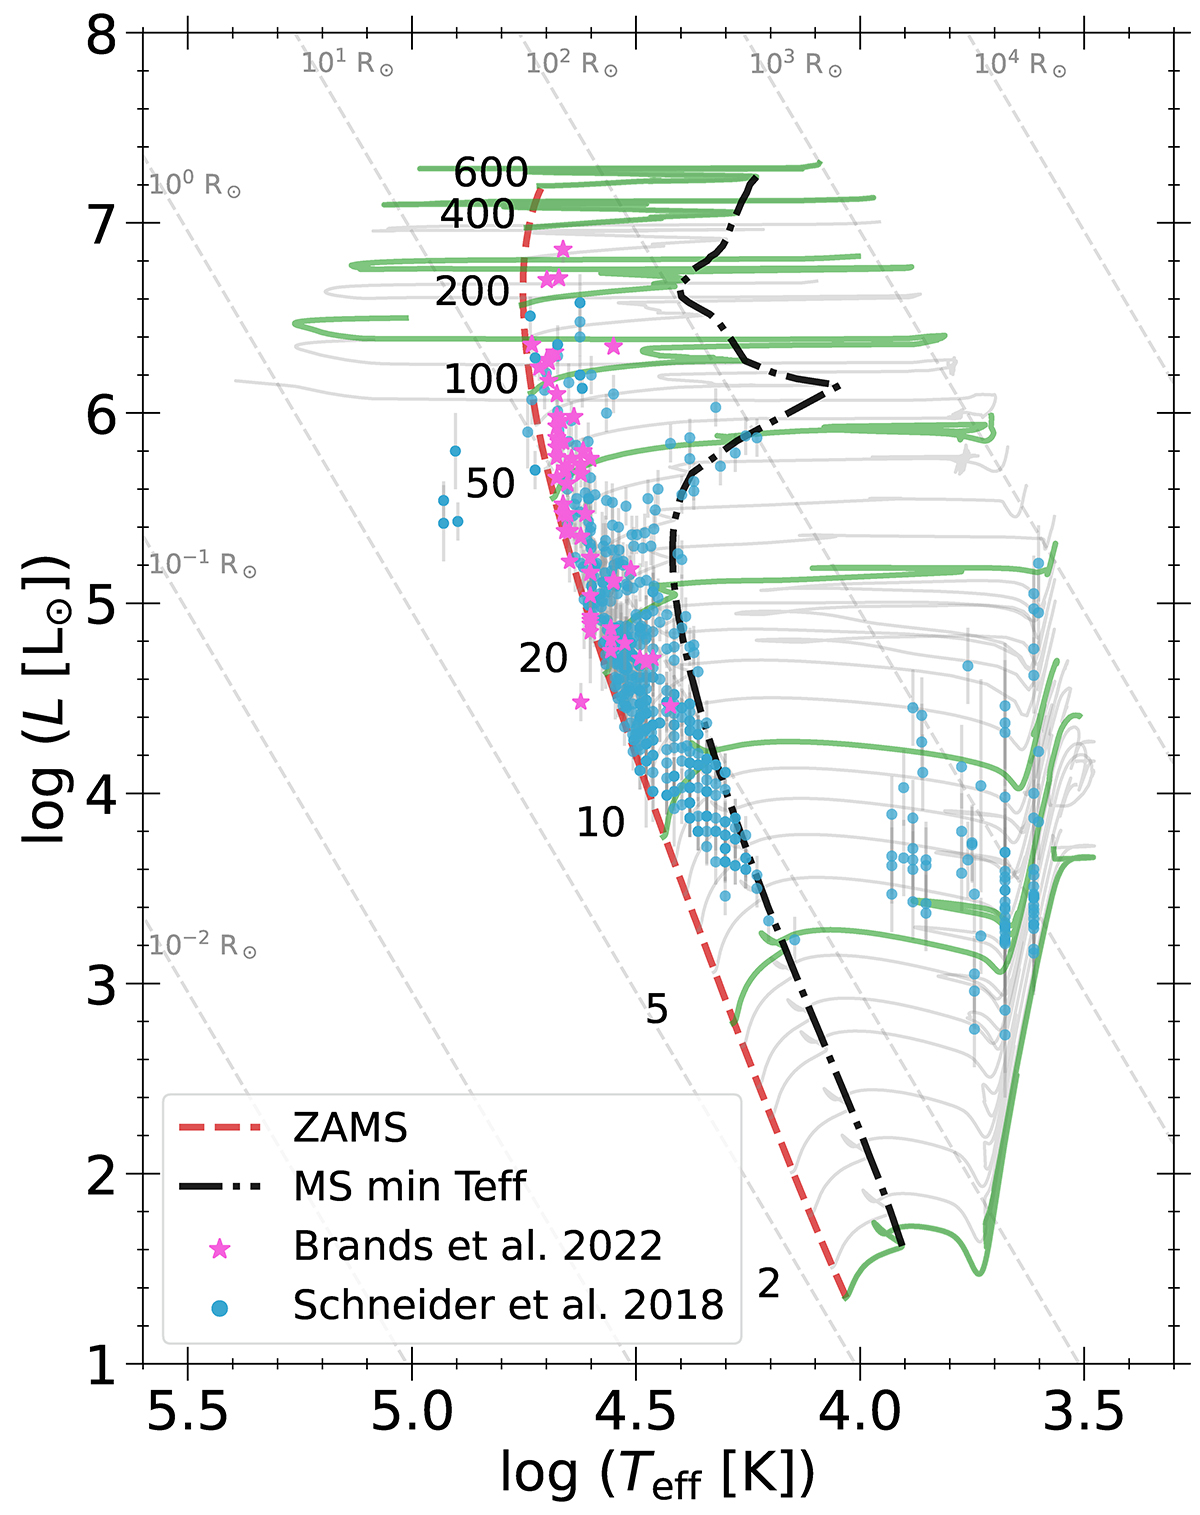
Comparison between data of stars in the Tarantula Nebula and PARSEC stellar tracks in the HR diagram. Pink stars and blue dots are from Brands et al. (2022) and Schneider et al. (2018), respectively. Over plotted is the set of tracks with Z = 0.006. The dashed red and dash-dotted black lines indicate the ZAMS and TAMS, respectively.
Current usage metrics show cumulative count of Article Views (full-text article views including HTML views, PDF and ePub downloads, according to the available data) and Abstracts Views on Vision4Press platform.
Data correspond to usage on the plateform after 2015. The current usage metrics is available 48-96 hours after online publication and is updated daily on week days.
Initial download of the metrics may take a while.