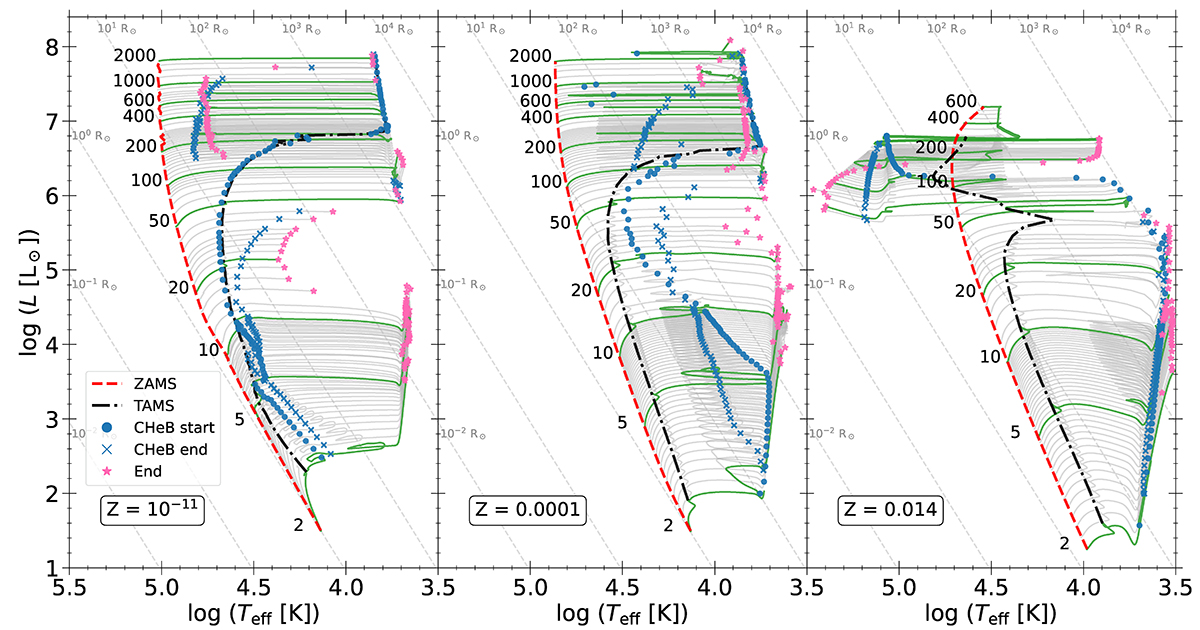
Fig. 1.
Download original image
HR diagrams of tracks computed with Z = 10−11, Z = 0.001 and Z = 0.014, in the left-hand, center, and right-hand panels, respectively. Tracks are shown beginning from the ZAMS, indicated by the dashed red line. The dash-dotted black line indicates the TAMS. Blue dots (crosses) indicate the beginning (end) of core helium-burning, respectively. Pink stars indicate the final position of the star. The pre-MS phase is not shown for clarity. The stellar mass in solar masses of some selected tracks indicated by the solid green lines is written near their corresponding ZAMS position. Diagonal dashed gray lines show constant stellar radii as labeled.
Current usage metrics show cumulative count of Article Views (full-text article views including HTML views, PDF and ePub downloads, according to the available data) and Abstracts Views on Vision4Press platform.
Data correspond to usage on the plateform after 2015. The current usage metrics is available 48-96 hours after online publication and is updated daily on week days.
Initial download of the metrics may take a while.