Fig. 7
Download original image
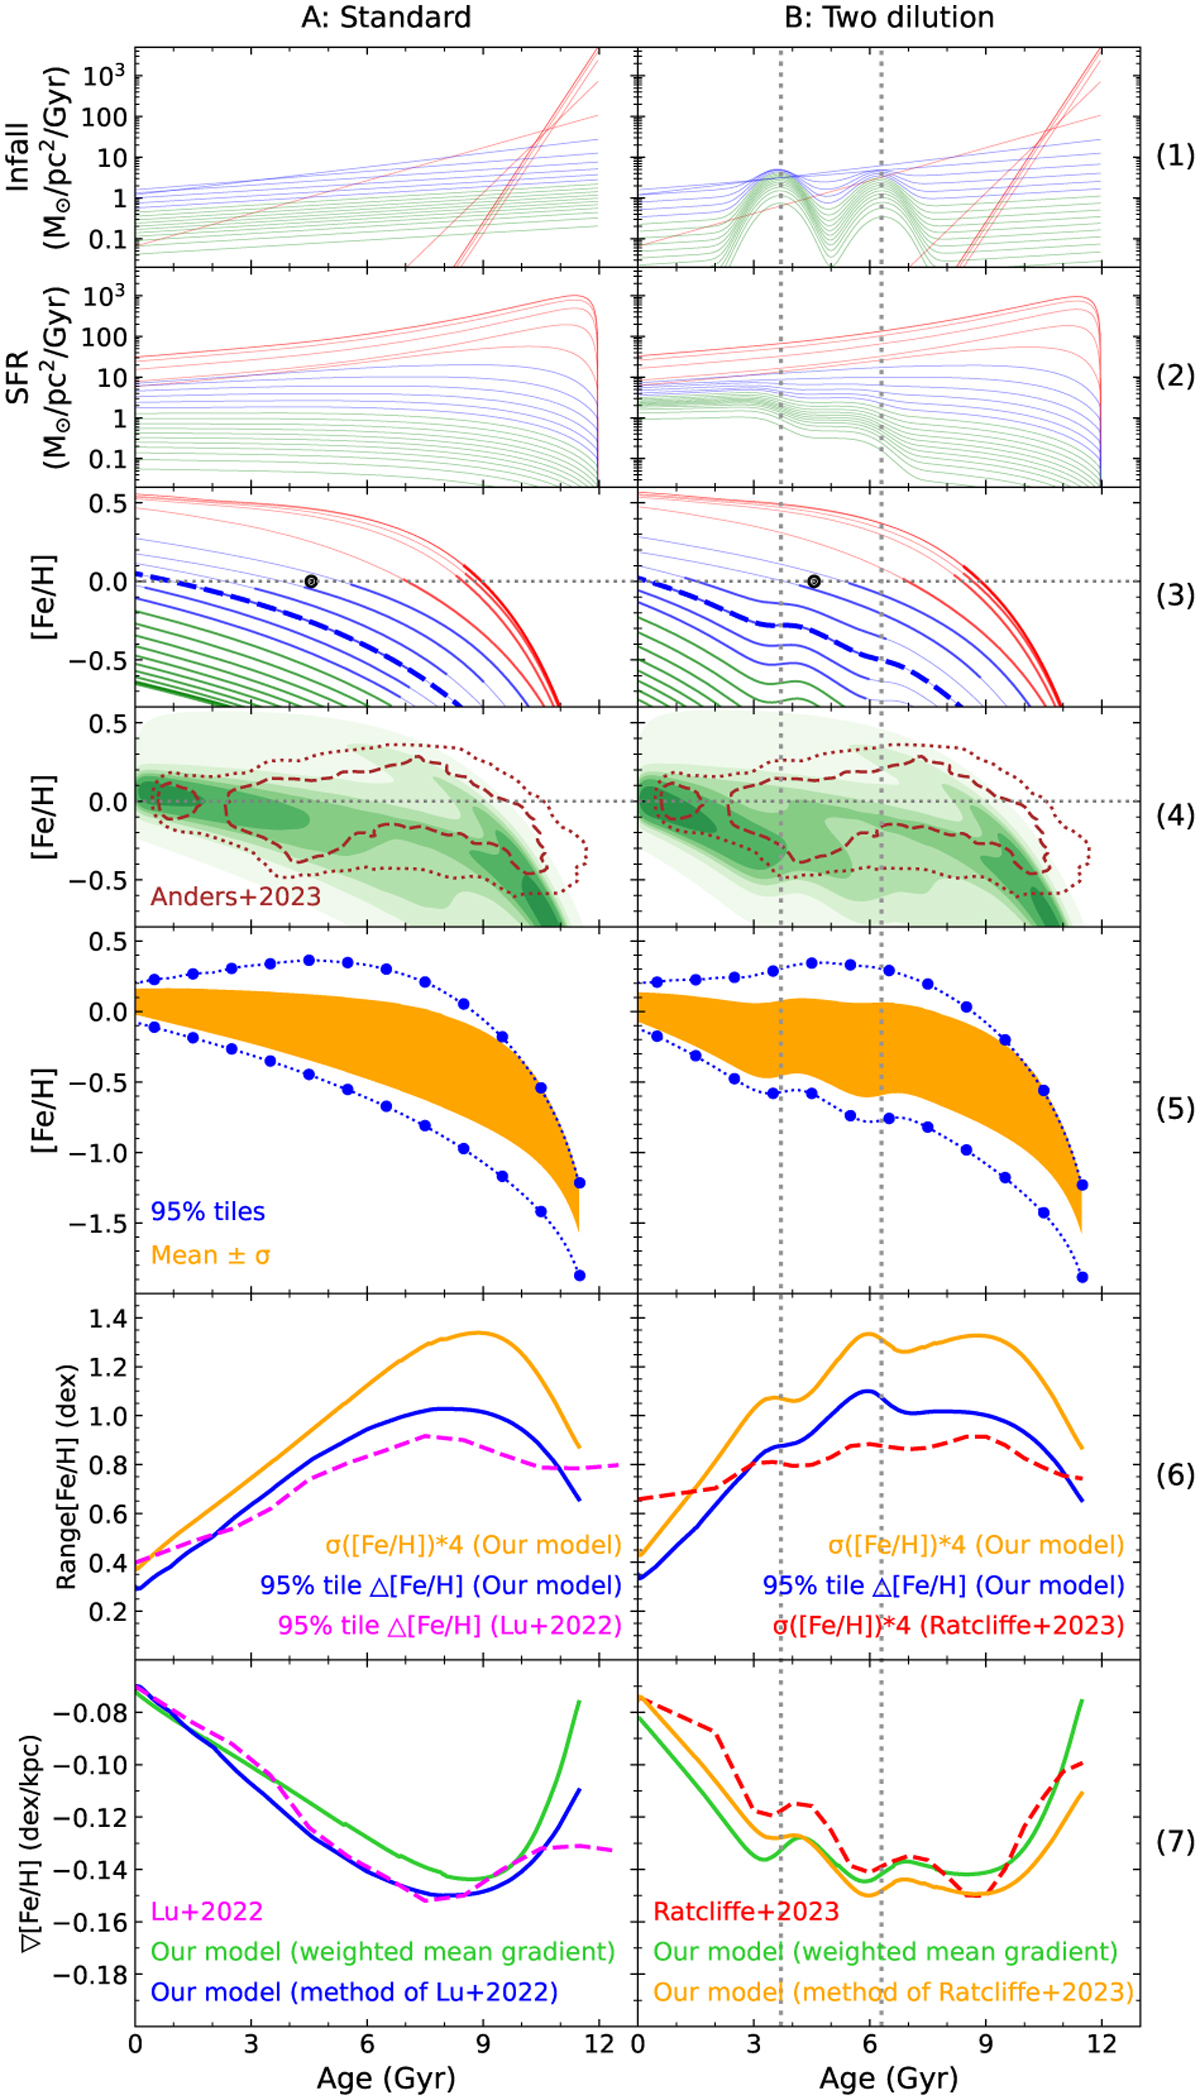
Comparative evolution of several quantities for the baseline model (column A on the left) and the case of two recent infall episodes in the outer disc (column B on the right). Top: infall rate in various radial zones, with the curves colour-coded as in previous figures (red: inner zones, blue: intermediate, green: outer; thick dashed: 8 kpc). Second from top: corresponding local SFRs. The subsequent five rows of panels are the same as in Fig. 5.
Current usage metrics show cumulative count of Article Views (full-text article views including HTML views, PDF and ePub downloads, according to the available data) and Abstracts Views on Vision4Press platform.
Data correspond to usage on the plateform after 2015. The current usage metrics is available 48-96 hours after online publication and is updated daily on week days.
Initial download of the metrics may take a while.