Fig. 6
Download original image
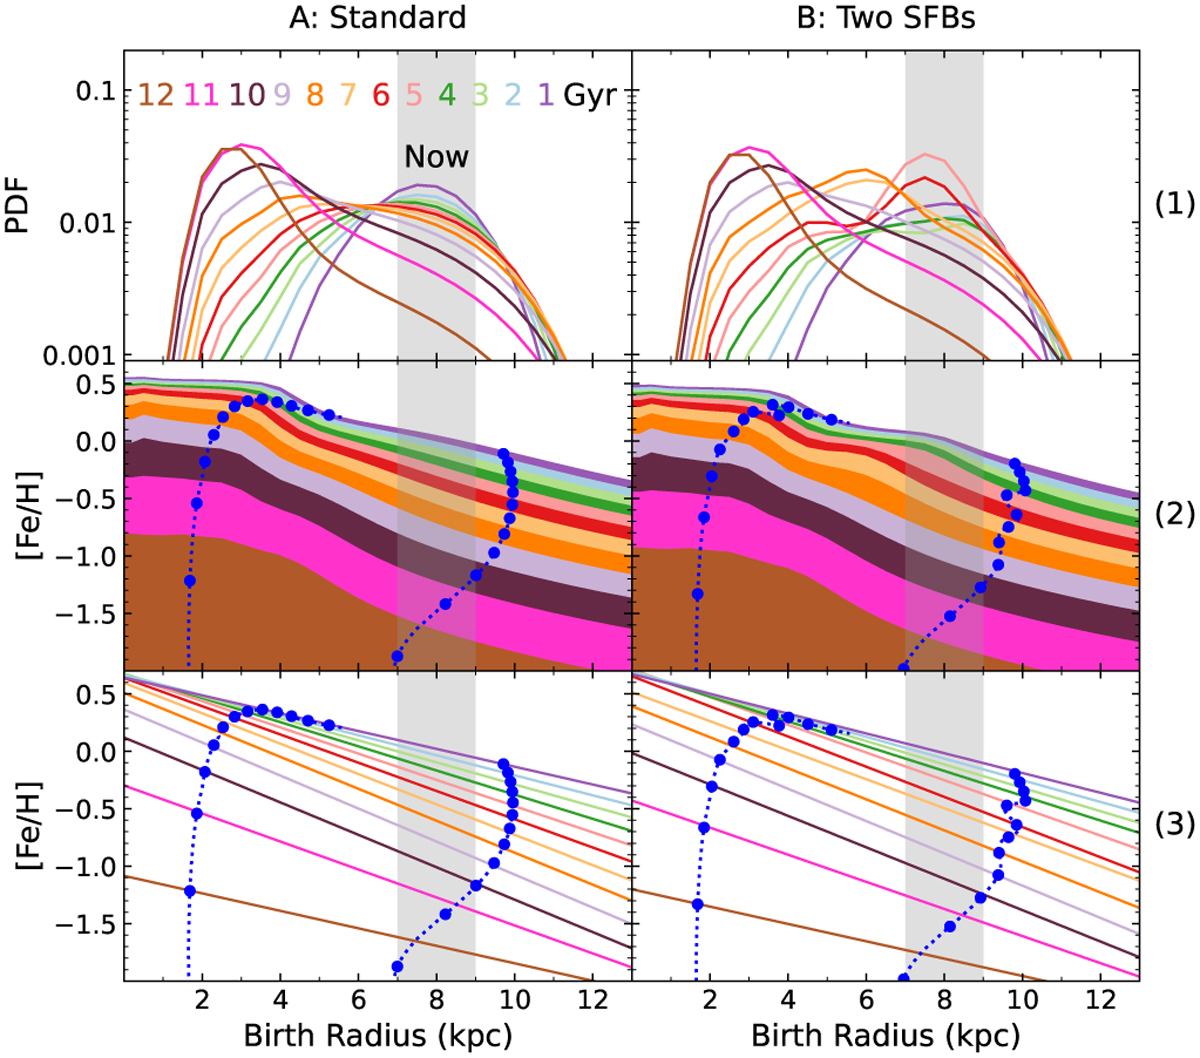
Top: distribution of birth radii Rb of stars currently found in the solar vicinity (grey shaded area in all panels, extending from 7–9 kpc) for stars of different ages (in 1-Gyr wide bins, colour-coded by age), as predicted by our standard (left) and 2-SFB (right) models. Middle: radial metallicity profile of each mono-age population. The blue dots indicate boundaries including 95%-tiles of model local stars in the Rb distributions of the top panel. Bottom: the dashed lines represent the mass weighted (according to the distributions of the top panel) abundance gradient of each mono-age population.
Current usage metrics show cumulative count of Article Views (full-text article views including HTML views, PDF and ePub downloads, according to the available data) and Abstracts Views on Vision4Press platform.
Data correspond to usage on the plateform after 2015. The current usage metrics is available 48-96 hours after online publication and is updated daily on week days.
Initial download of the metrics may take a while.