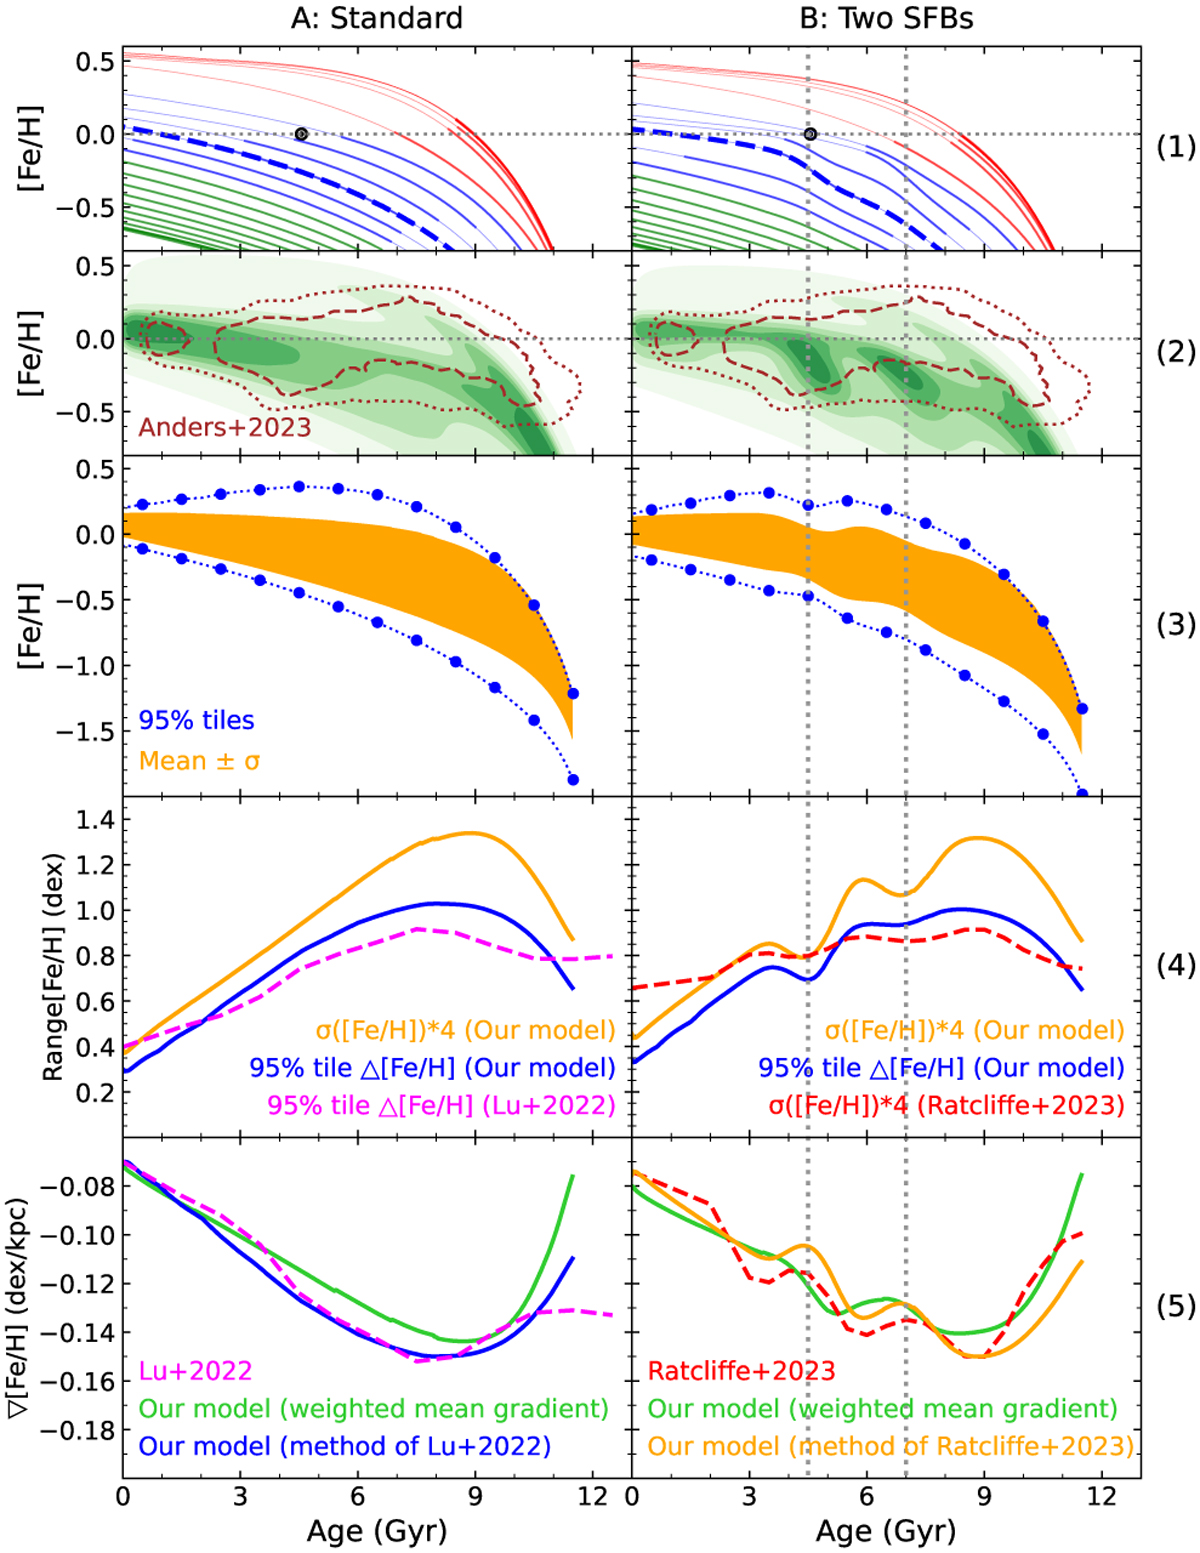
Fig. 5
Download original image
Age–metallicity relations and gradient evolutions in our standard model (left column, compared to Lu et al. 2024a) and in the two-SFB model (right column, compared to Ratcliffe et al. 2023). Row 1: gaseous metallicity every two zones of the model. Row 2: density isocontours for the solar vicinity in the model (shaded, as in Fig. 2) and in Anders et al. (2023) (brown); the introduction of a SFB at 4.5 Gyr and 7 Gyr produces two local overdensities, as in the data. Row 3: age–metallicity relation in the solar vicinity with metallicity ranges indicated by mean±1 σ values (orange shaded area) and 95%-tiles (between the blue dotted curves featuring larger points every Gyr). Row 4: metallicity ranges Δ[Fe/H] (blue and orange curves derived from the data of same colour in the previous panels) and observationally inferred by Lu et al. (2024a, dashed magenta, left panel) and Ratcliffe et al. (2023, dashed red, right panel). Row 5: evolution of the abundance gradient, in observations from Lu et al. (2024a, dashed magenta, left panel) and Ratcliffe et al. (2023, dashed red, right panel), as well as in our model obtained either with our method of mass-weighted gradient (solid green curves in both panels, see text) or with the method of Lu et al. (2024a, solid blue, left panel) and Ratcliffe et al. (2023, solid orange, right panel).
Current usage metrics show cumulative count of Article Views (full-text article views including HTML views, PDF and ePub downloads, according to the available data) and Abstracts Views on Vision4Press platform.
Data correspond to usage on the plateform after 2015. The current usage metrics is available 48-96 hours after online publication and is updated daily on week days.
Initial download of the metrics may take a while.