Fig. 4
Download original image
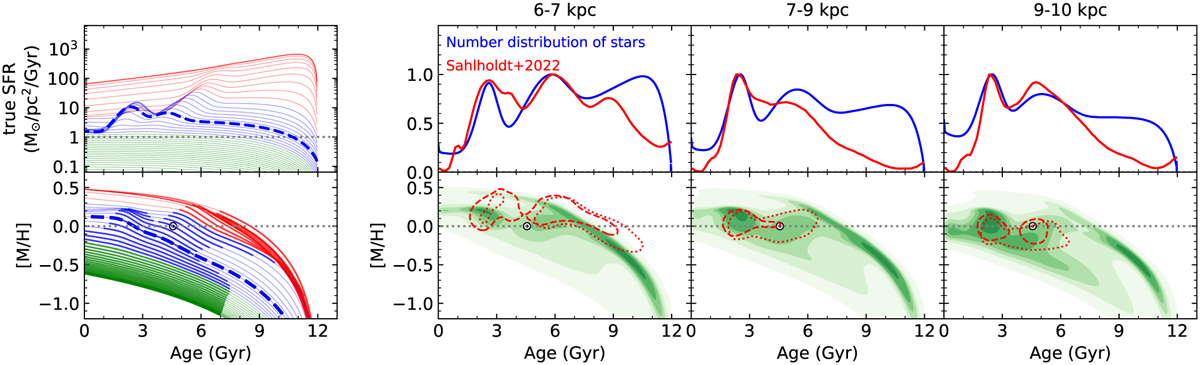
Results of the propagated SFB model. Left: same as the second and fourth row of Fig. 2, for the evolution of SFR and [M/H], Right: age distributions are displayed in the top panel for different radial ranges of 6–7, 7–9 and 9–10 kpc, corresponding to the equivalent observational sub-samples in inner, local, and outer bins shown in Fig. 6 of Sahlholdt et al. (2022); observations (red curves) are compared to model results (blue curves). In the lower panels, age–metallicity relations of the model (green isodensity contours) are compared to half-maximum density contours from observations of Sahlholdt et al. (2022) (dotted and dashed red curves indicate the high-ɀmax and low-ɀmax part of observations in each radial range).
Current usage metrics show cumulative count of Article Views (full-text article views including HTML views, PDF and ePub downloads, according to the available data) and Abstracts Views on Vision4Press platform.
Data correspond to usage on the plateform after 2015. The current usage metrics is available 48-96 hours after online publication and is updated daily on week days.
Initial download of the metrics may take a while.