Fig. 3
Download original image
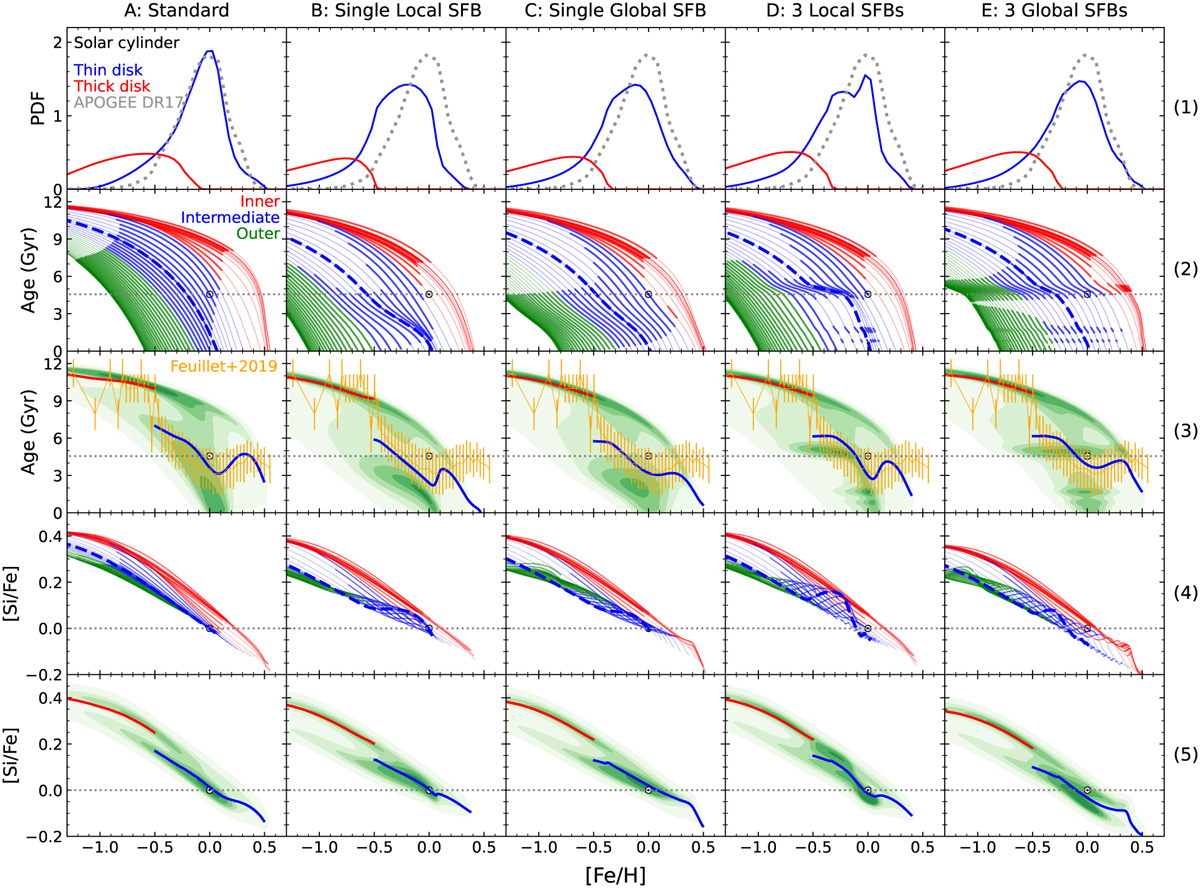
Model results (colour coded as in Fig. 2) and comparison to observations for various quantities as function of [Fe/H], Row 1: metallicity distributions for thin (blue) and thick (red) discs in the solar cylinder. The thin ones are compared to the red giants near the plane (|ɀ| < 0.3 kpc) from the APOGEE DR17 (dotted grey). Row 2: age-metallicity relation for all radial zones. Row 3: predicted age versus [Fe/H] distribution present in the solar cylinder. The average ages of thin and thick discs (red and blue curves) are compared to data from Feuillet et al. (2019) shown by orange curves with vertical error bars. Row 4: gas evolution of the various radial zones of the model in the [Si/Fe]-[Fe/H] plane. Row 5: predicted [Si/Fe] versus [Fe/Hl distribution present in solar cylinder.
Current usage metrics show cumulative count of Article Views (full-text article views including HTML views, PDF and ePub downloads, according to the available data) and Abstracts Views on Vision4Press platform.
Data correspond to usage on the plateform after 2015. The current usage metrics is available 48-96 hours after online publication and is updated daily on week days.
Initial download of the metrics may take a while.