Fig. 1
Download original image
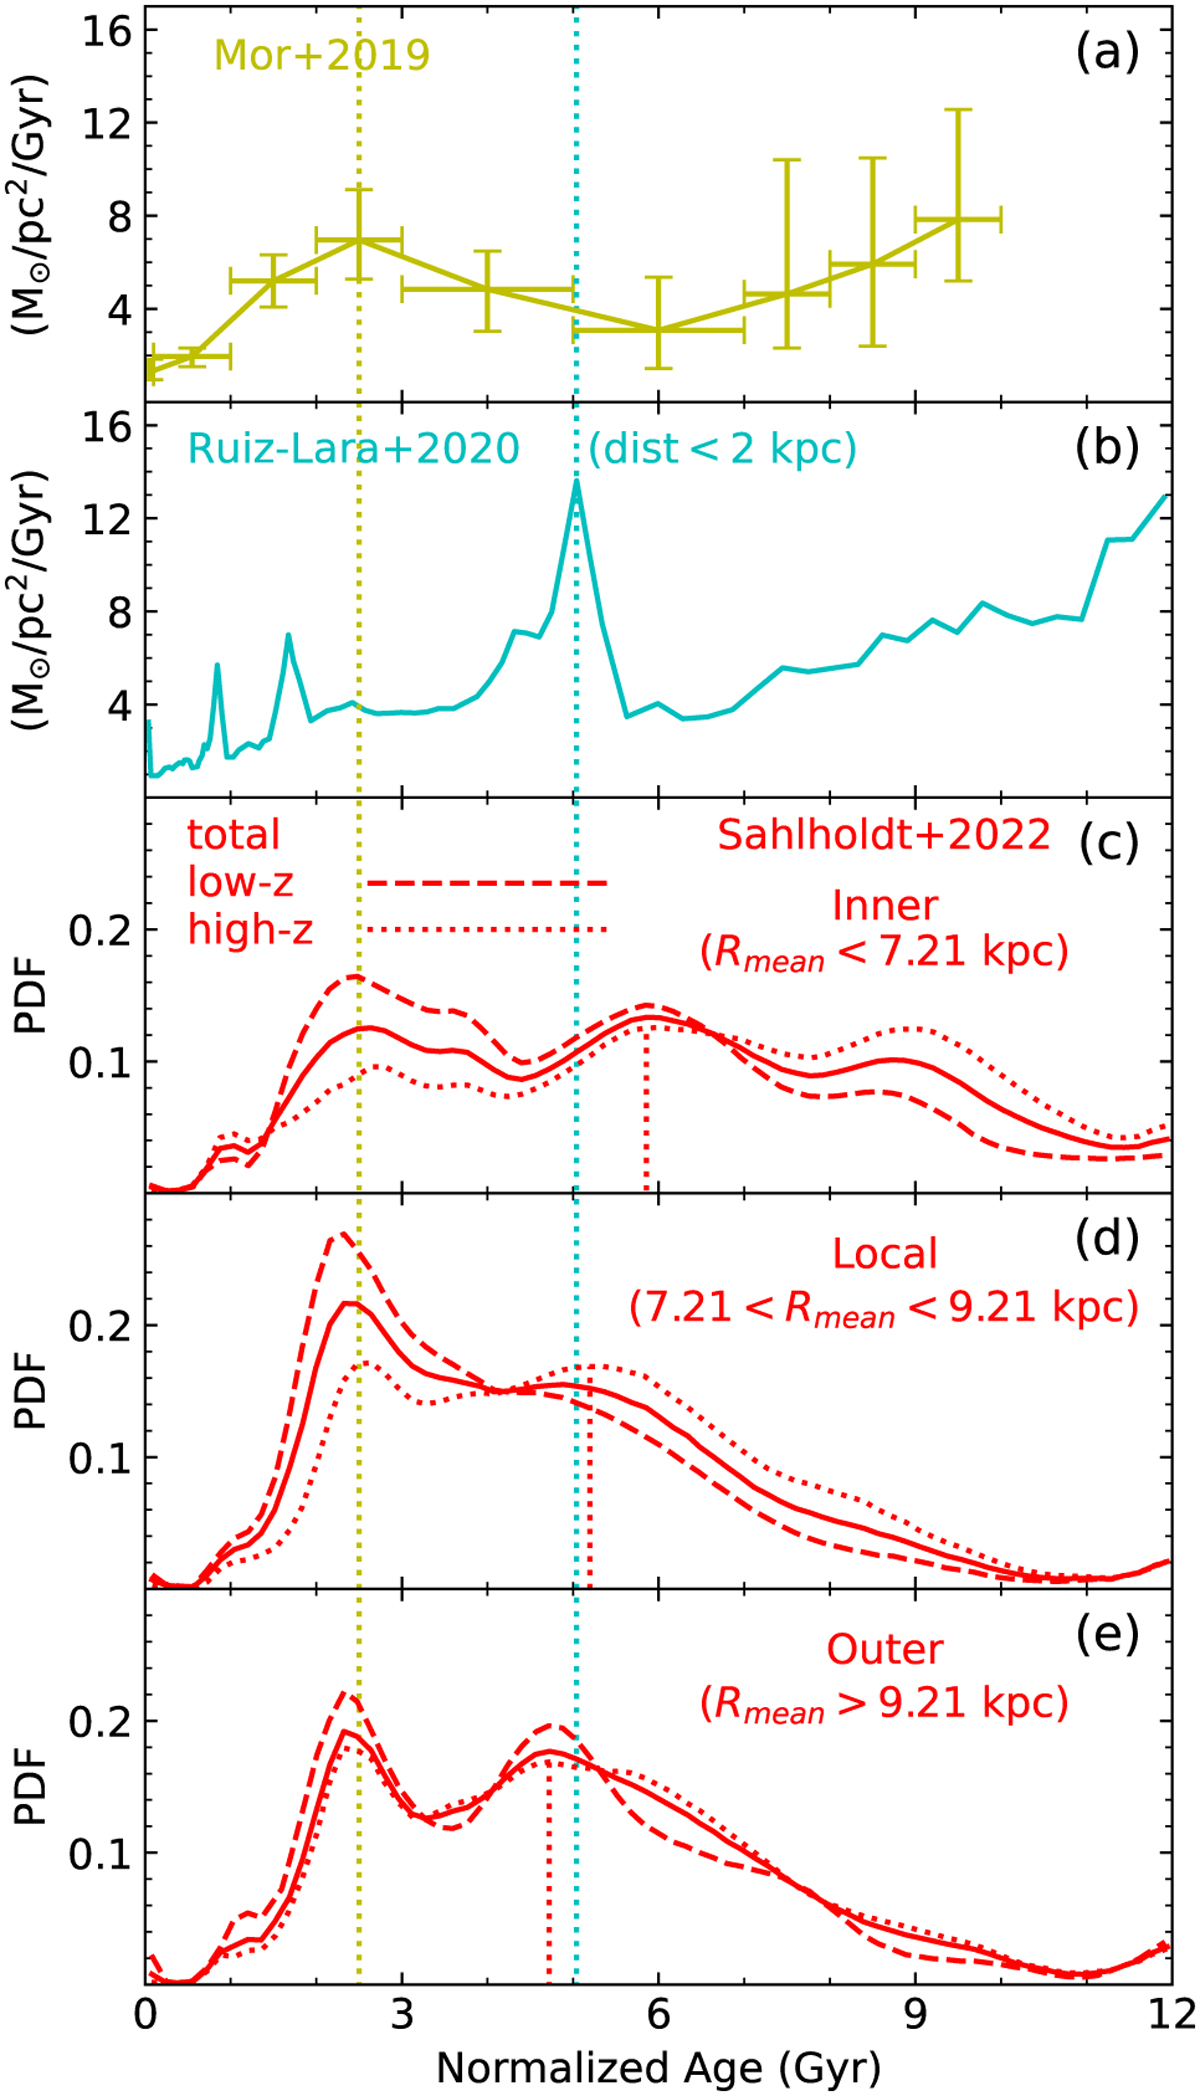
Recently reported episodes of star formation in the late history of the local region of our Galaxy. From top to bottom: (a) SFR obtained from main-sequence stars (Mor et al. 2019), with error bars in age and SFR intensity. (b) The cyan curve represents the SFH in a bubble of radius ∼2 kpc around the Sun (Ruiz-Lara et al. 2020). The three subsequent panels display results for age distribution of stars obtained from Sahlholdt et al. (2022) for (c) the inner, (d) the local and (e) the outer Galactic disc; in those three panels dashed curves correspond to the situation close to the plane and dotted ones away from the plane, with solid curve representing the total (in percentage). The age range of all data is normalised to the time duration of our model (Tmax = 12 Gyr). In (a) and (b), observations are normalised to the present-day local star surface density (38 M⊙ /pc2) with the adopted IMF of Kroupa (2002). The two vertical lines are to guide the eye and correspond to the centroids of the SFB of Mor et al. (2019), of the strongest SFB of Ruiz-Lara et al. (2020) and of the first SFB of Sahlholdt et al. (2022).
Current usage metrics show cumulative count of Article Views (full-text article views including HTML views, PDF and ePub downloads, according to the available data) and Abstracts Views on Vision4Press platform.
Data correspond to usage on the plateform after 2015. The current usage metrics is available 48-96 hours after online publication and is updated daily on week days.
Initial download of the metrics may take a while.