Fig. 6
Download original image
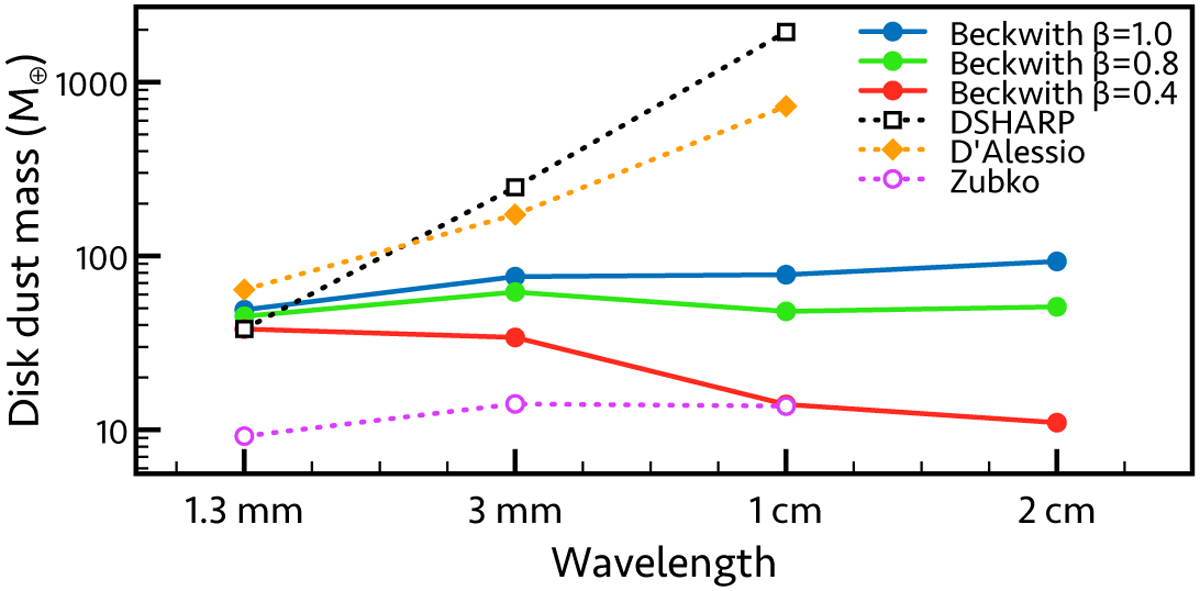
Average dust mass at different wavelengths and with different opacities. The average disk dust mass from our sample is calculated from 1.3-mm, 3-mm, 1-cm, and 2-cm fluxes, assuming optically thin emission, and with different sets of opacity (Beckwith et al. 1990; Zubko et al. 1996; D’Alessio et al. 2001; Birnstiel et al. 2018, with amax = 1 mm). A slightly different number of targets contribute to the individual data points across wavelengths depending on the available photometry.
Current usage metrics show cumulative count of Article Views (full-text article views including HTML views, PDF and ePub downloads, according to the available data) and Abstracts Views on Vision4Press platform.
Data correspond to usage on the plateform after 2015. The current usage metrics is available 48-96 hours after online publication and is updated daily on week days.
Initial download of the metrics may take a while.