Fig. 3
Download original image
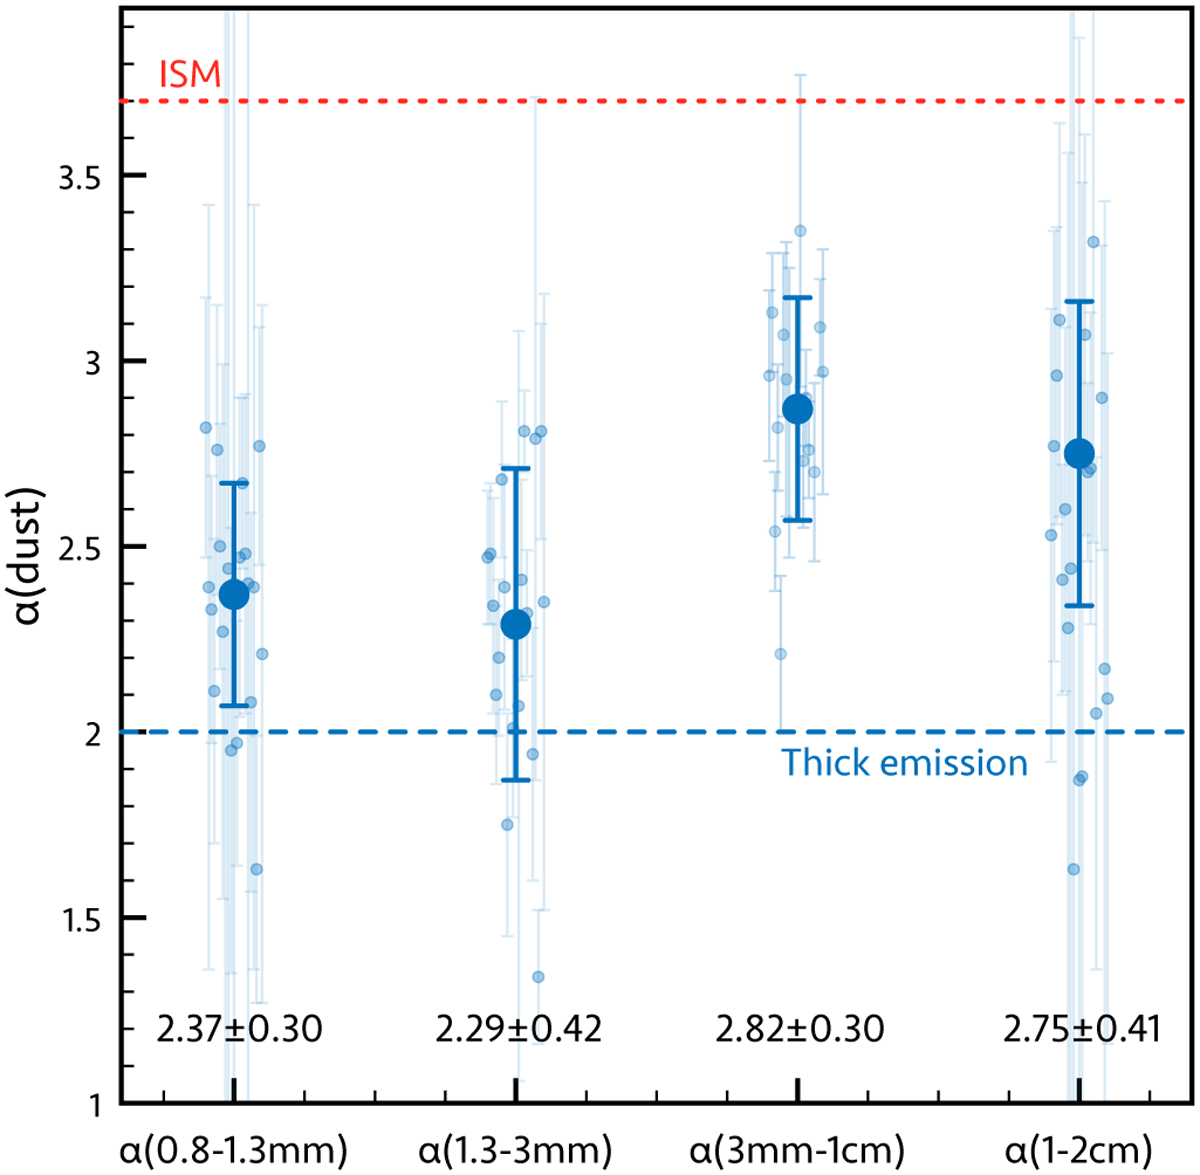
Millimeter and centimeter dust spectral indices. The individual α at four different spectral ranges are shown in semi-transparency. These are obtained by removing the free-free emission from our photometry and comparing with literature values (see text). The big foreground symbols are the average values for the entire sample. The error bars of the individual sources are inherited from the uncertainty on the photometry, while those of the averages are the dispersion of the relative sample. The red line indicates the spectral index of the interstellar dust grains in the millimeter index, while the blue line shows the expected index from optically thick emission.
Current usage metrics show cumulative count of Article Views (full-text article views including HTML views, PDF and ePub downloads, according to the available data) and Abstracts Views on Vision4Press platform.
Data correspond to usage on the plateform after 2015. The current usage metrics is available 48-96 hours after online publication and is updated daily on week days.
Initial download of the metrics may take a while.