Fig. 2
Download original image
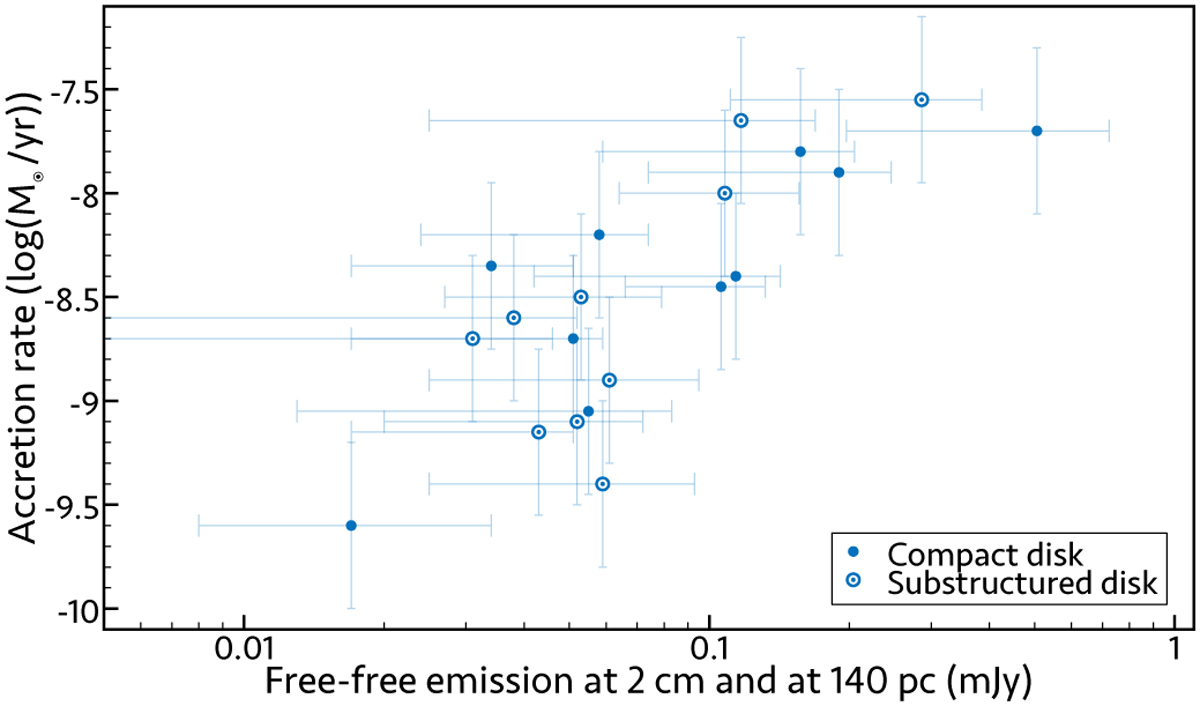
Free-free emission versus mass accretion rate. The free-free emission at 2 cm constrained by our model (see Sect. 3.2) for the entire sample is scaled to 140 pc and compared with the mass-accretion rates shown in Table 1. Despite large errors, a correlation between both quantities is clearly seen across several orders of magnitude. Nonetheless, the distribution of compact disks against substructured disks appears random. HP Tau (with a free-free emission at 140 pc of approximately 10 mJy and an accretion rate of 2.5 ⋅ 10−11 M⊙ yr−1) clearly falls out of the correlation and is not shown in order to provide a better view of the plot.
Current usage metrics show cumulative count of Article Views (full-text article views including HTML views, PDF and ePub downloads, according to the available data) and Abstracts Views on Vision4Press platform.
Data correspond to usage on the plateform after 2015. The current usage metrics is available 48-96 hours after online publication and is updated daily on week days.
Initial download of the metrics may take a while.