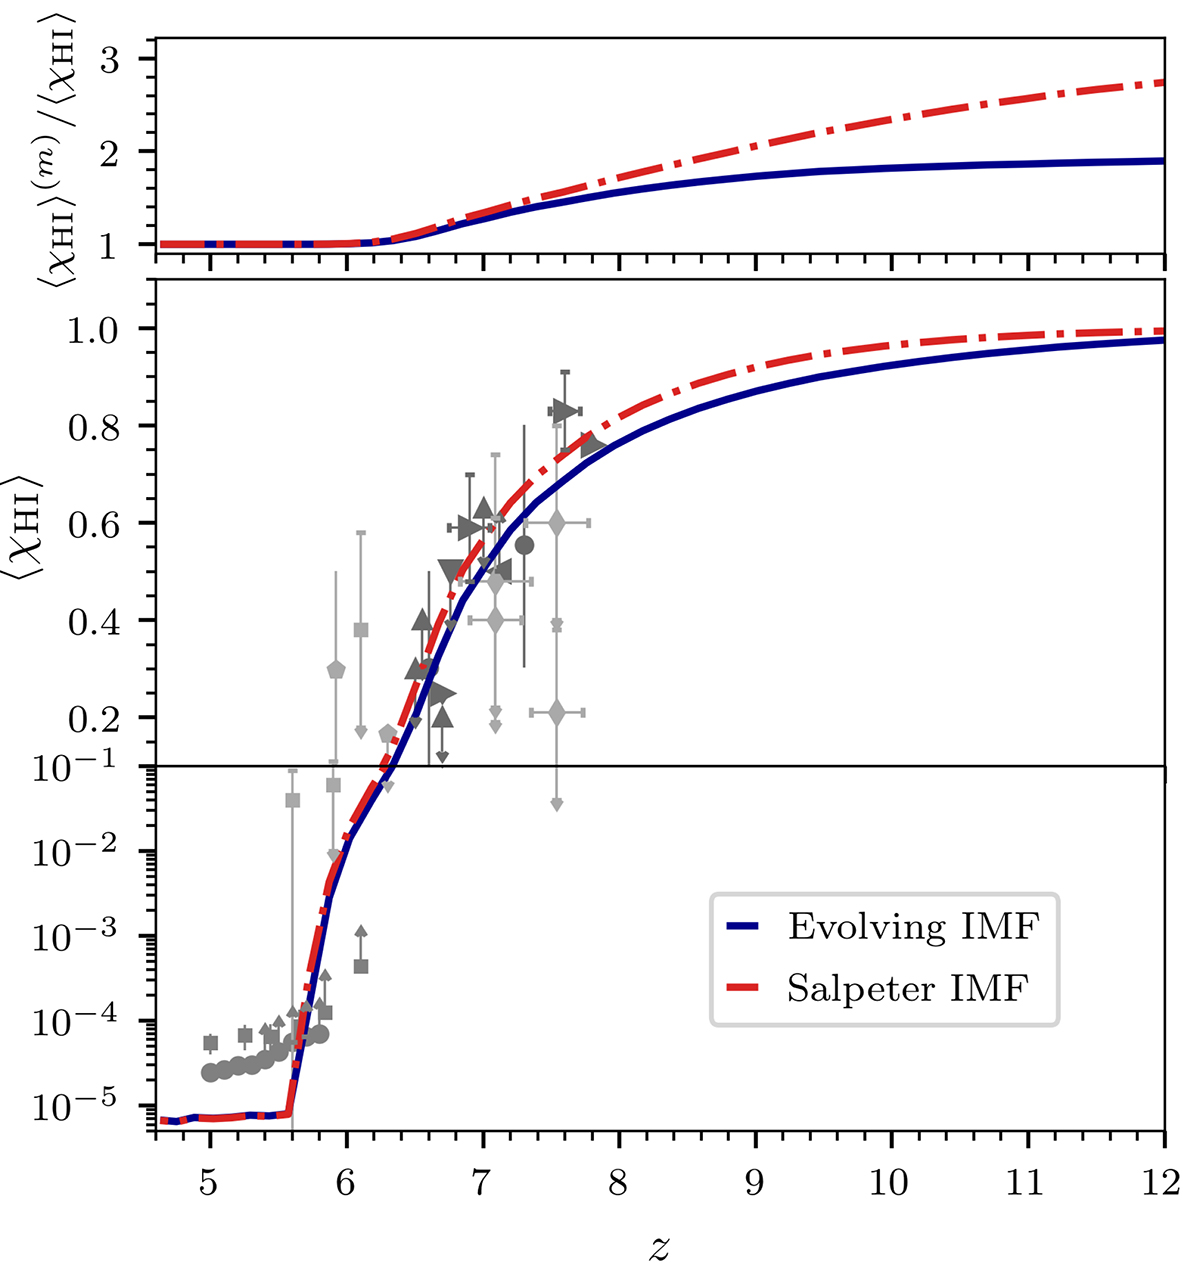
Fig. 7.
Download original image
Redshift evolution of the global IGM H I fraction for the Salpeter IMF (red) and evolving IMF (blue) model (bottom) and the ratio between the mass-averaged and volume-averaged IGM H I fractions (top). Grey points indicate observational constraints from: GRB optical afterglow spectrum analyses (light pentagons; Totani et al. 2006, 2014), quasar sightlines (faint squares; Fan et al. 2006), (medium bright circles; Bosman et al. 2022) Lyman-α LFs (dark upward triangles; Konno et al. 2018; Kashikawa et al. 2011; Ouchi et al. 2010; Ota et al. 2010; Malhotra & Rhoads 2004), Lyman-α emitter clustering (dark downwards triangles; Ouchi et al. 2010), the Lyman-α emitting galaxy fraction (dark leftwards triangles; Pentericci et al. 2011; Schenker et al. 2012; Ono et al. 2012; Treu et al. 2012; Caruana et al. 2012, 2014; Pentericci et al. 2014), Lyman-α equivalent widths (dark rightwards triangles; Mason et al. 2018, 2019; Bolan et al. 2022), dark pixels (light squares; McGreer et al. 2015), and damping wings (light diamonds; Davies et al. 2018; Greig et al. 2019).
Current usage metrics show cumulative count of Article Views (full-text article views including HTML views, PDF and ePub downloads, according to the available data) and Abstracts Views on Vision4Press platform.
Data correspond to usage on the plateform after 2015. The current usage metrics is available 48-96 hours after online publication and is updated daily on week days.
Initial download of the metrics may take a while.