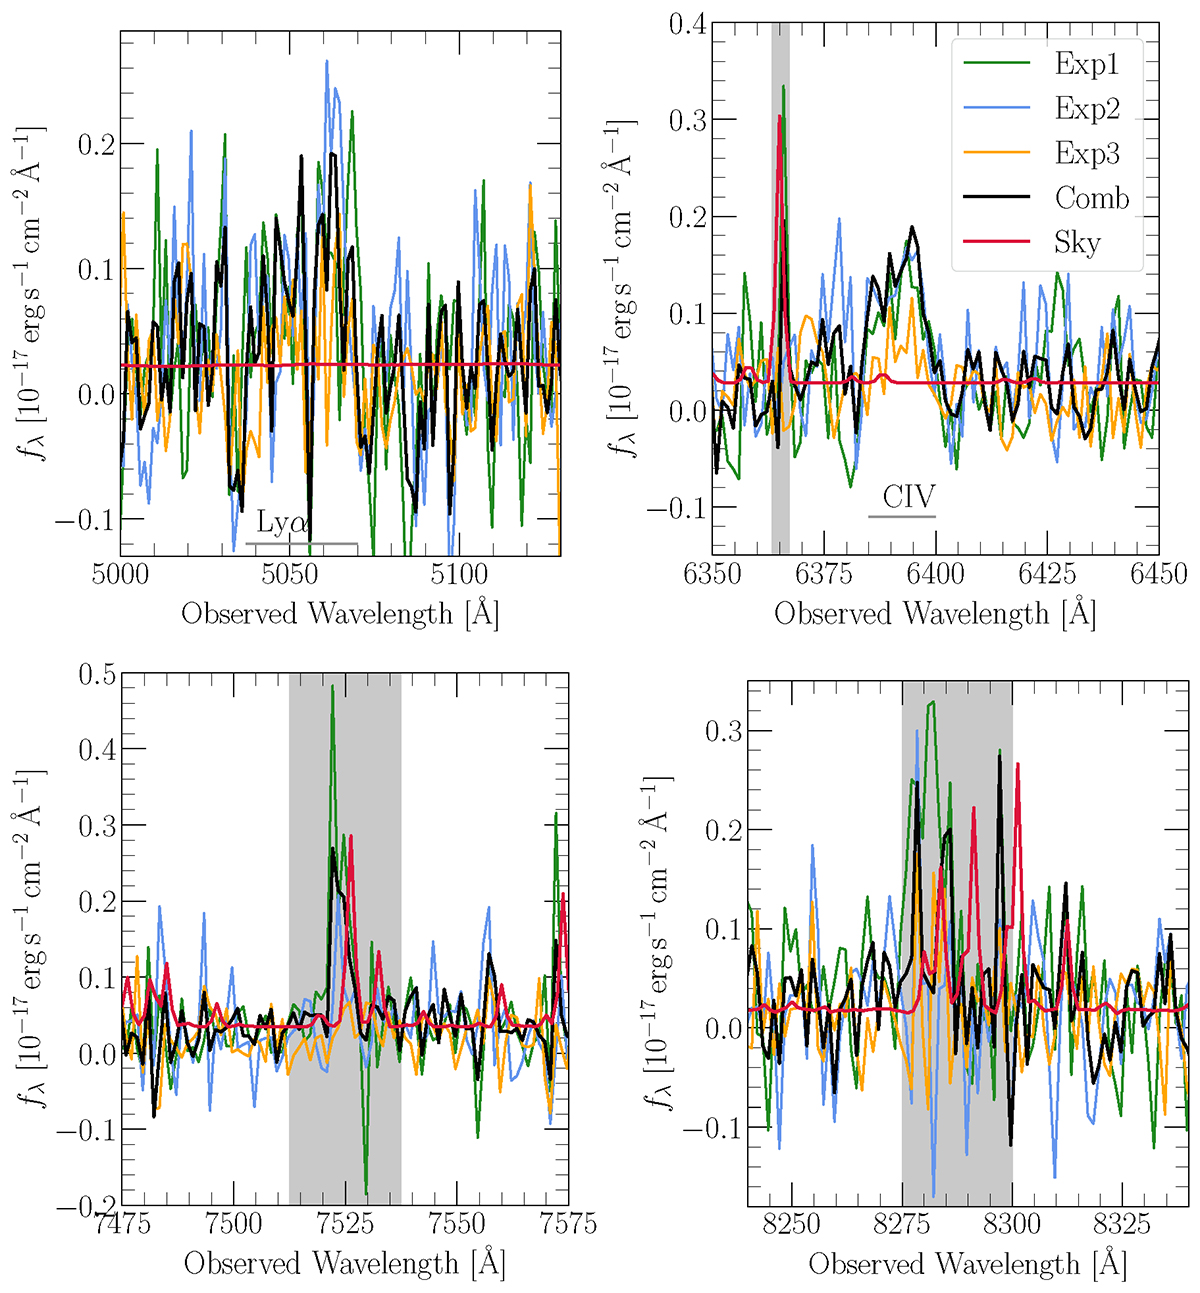
Fig. E.2.
Download original image
Unsmoothed spectra of AGNc2 extracted from the three exposures (Exp1, Exp2, Exp3, green, blue, yellow, respectively) and the combined cube (Comb, black) in spectral windows of narrow emission lines. A sky emission spectrum (Sky, red) is plotted in arbitrary flux units showing the position of atmospheric emission lines. Shaded gray areas are the same as in Fig. 2. To avoid contamination of the close-by C IV λ1550 line, the sky emission line in the top right panel is masked before smoothing. The spectral extraction region falls onto the masked CCD gap in the third exposure, leading to a lower flux. We note that we performed the median combination of the cubes pixel by pixel but summed the displayed spectra over multiple pixels. Consequently, the spectrum extracted from the median-combined cube differs from the median spectrum of those from the individual exposures.
Current usage metrics show cumulative count of Article Views (full-text article views including HTML views, PDF and ePub downloads, according to the available data) and Abstracts Views on Vision4Press platform.
Data correspond to usage on the plateform after 2015. The current usage metrics is available 48-96 hours after online publication and is updated daily on week days.
Initial download of the metrics may take a while.