Open Access
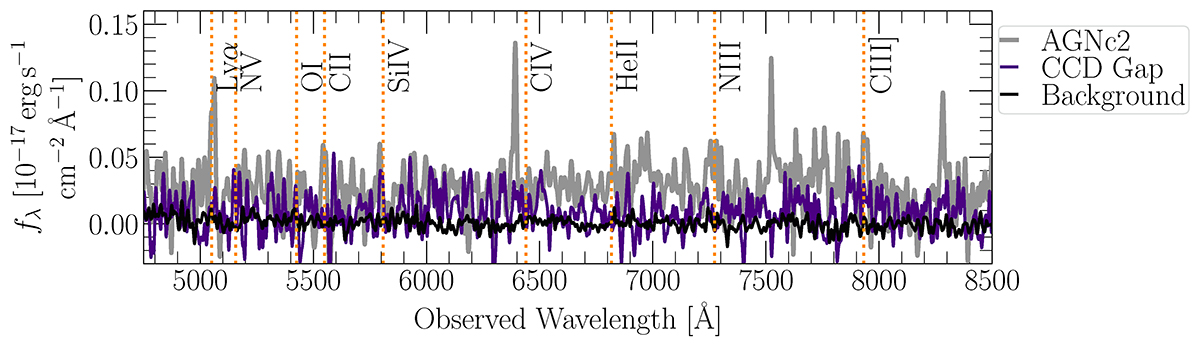
Fig. E.1.
Download original image
Check for possible sources of contamination in the spectrum of AGNc2. The spectrum taken from the region affected by CCD gap artifacts and the mean background spectrum are compared to the spectrum of AGNc2 and its expected emission line wavelengths.
Current usage metrics show cumulative count of Article Views (full-text article views including HTML views, PDF and ePub downloads, according to the available data) and Abstracts Views on Vision4Press platform.
Data correspond to usage on the plateform after 2015. The current usage metrics is available 48-96 hours after online publication and is updated daily on week days.
Initial download of the metrics may take a while.