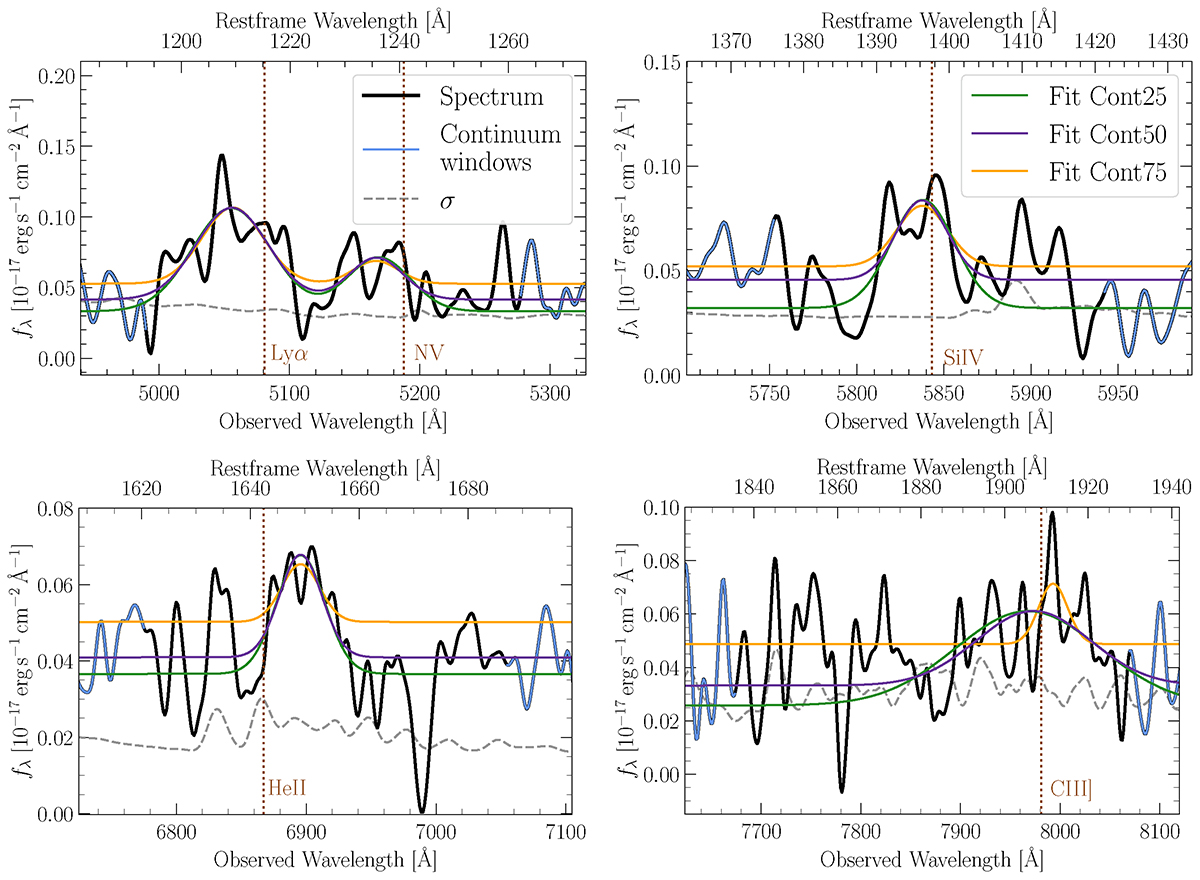
Fig. B.1.
Download original image
Gaussian fit to the emission lines after subtraction of the three different continua (Cont25, Cont50, Cont75) from the spectrum of AGNc1, smoothed by a 1D Gaussian kernel with σ = 3 pixels. The vertical dotted brown line indicates the expected wavelength λsys of the respective emission line, highlighting that the redshift determined from the peak of the C III]λ1908 line complex could be overestimated and the He II λ1640 line might be misidentified. Blue spectral regions mark the 50 Å windows used to calculate the continuum.
Current usage metrics show cumulative count of Article Views (full-text article views including HTML views, PDF and ePub downloads, according to the available data) and Abstracts Views on Vision4Press platform.
Data correspond to usage on the plateform after 2015. The current usage metrics is available 48-96 hours after online publication and is updated daily on week days.
Initial download of the metrics may take a while.