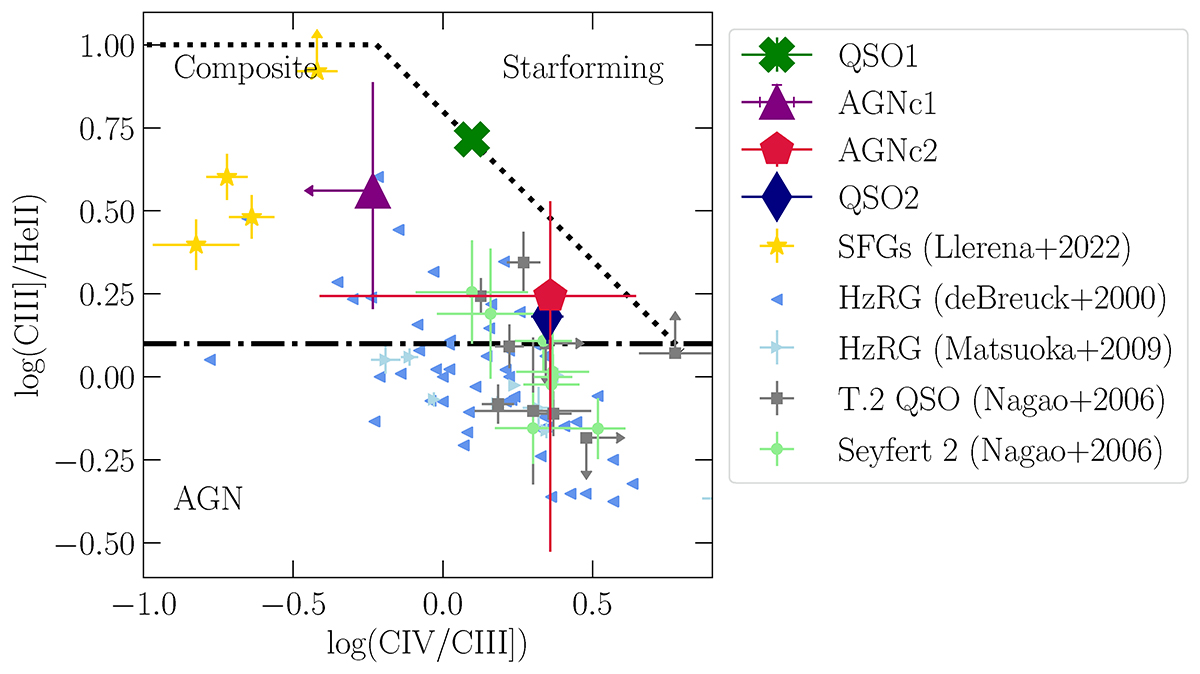
Fig. 3.
Download original image
Diagnostic diagram based on the line ratios C IV λ1550/C III]λ1908 and C III]λ1908/He II λ1640. Demarcation lines between AGN, SFGs, and composite line ratios are taken from Hirschmann et al. (2019). The values for QSO1, AGNc1, AGNc2, and QSO2 are compared to literature values for different types of galaxies: C III]λ1908-selected SFGs at z > 2.9 binned by stellar mass (Llerena et al. 2022), high-z radio galaxies with detections in all lines (De Breuck et al. 2000; Matsuoka et al. 2009), high-z X-ray selected type 2 quasars (Nagao et al. 2006), and local Seyfert 2 AGNs (Nagao et al. 2006).
Current usage metrics show cumulative count of Article Views (full-text article views including HTML views, PDF and ePub downloads, according to the available data) and Abstracts Views on Vision4Press platform.
Data correspond to usage on the plateform after 2015. The current usage metrics is available 48-96 hours after online publication and is updated daily on week days.
Initial download of the metrics may take a while.