Fig. 1.
Download original image
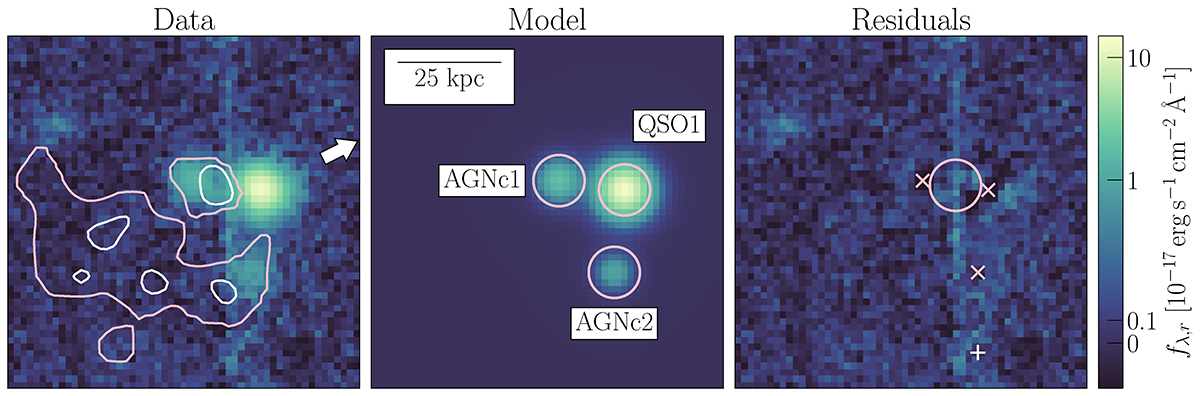
Continuum source modeling. Left: MUSE r-band map overlayed with the 2σ and 5σ isophotes (pink) of extended Lyα emission associated with the system (Herwig et al. 2024). Shown is a cut-out of size 11″ × 11″. Middle: Best-fitting Moffat model of the continuum sources. Pink circles indicate the apertures used for spectral extraction (Fig. 2). Right: Residual flux density after subtracting the model. The crosses show the centroid position of subtracted sources. The pink circle indicates the aperture used to calculate the maximum apparent magnitude of an interloping galaxy (if any). The white cross shows the position of the spectrum used to evaluate the amount of CCD gap contamination (Appendix E).
Current usage metrics show cumulative count of Article Views (full-text article views including HTML views, PDF and ePub downloads, according to the available data) and Abstracts Views on Vision4Press platform.
Data correspond to usage on the plateform after 2015. The current usage metrics is available 48-96 hours after online publication and is updated daily on week days.
Initial download of the metrics may take a while.