Fig. 3
Download original image
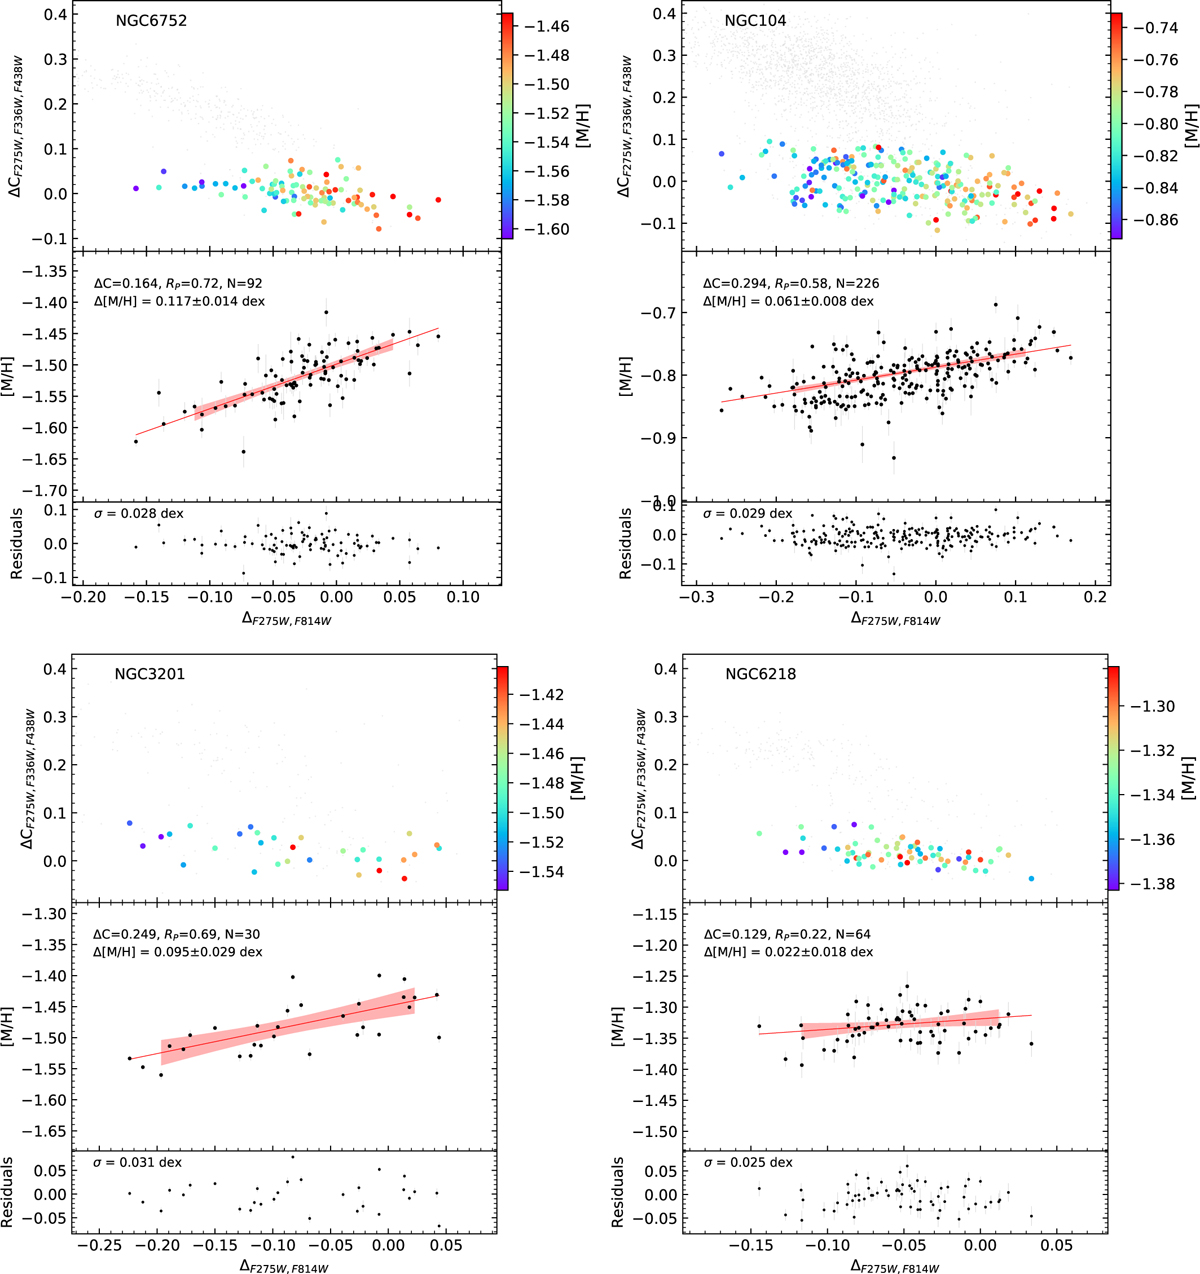
Metallicity [M/H] versus ΔF275W,F814W pseudo-color relationship for four GCs. Top panels: chromosome maps of the clusters with P1 stars within our sample color-coded by their metallicity. Middle panels: metallicity of each star, with the relationship derived from the WLS regression (red line) and the 95% confidence interval (red shaded area) over the color range ΔC. We also indicate the number of stars (N), the Pearson correlation coefficient (RP), and the resulting metallicity variation Δ[M/H]. Bottom panels: residuals (i.e., observed minus predicted metallicity). We indicate the standard deviation (σ) of the residuals.
Current usage metrics show cumulative count of Article Views (full-text article views including HTML views, PDF and ePub downloads, according to the available data) and Abstracts Views on Vision4Press platform.
Data correspond to usage on the plateform after 2015. The current usage metrics is available 48-96 hours after online publication and is updated daily on week days.
Initial download of the metrics may take a while.