Fig. 9
Download original image
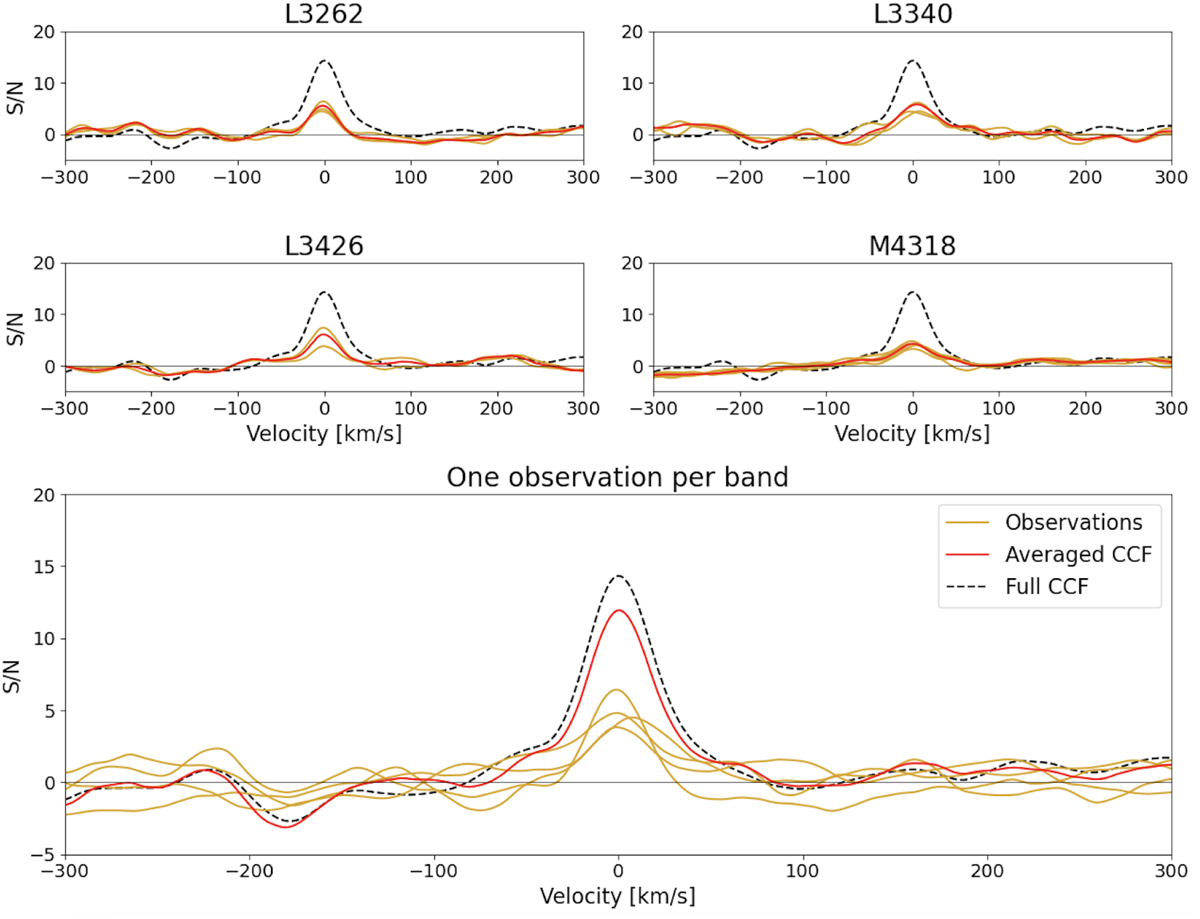
Cross-correlation results (normalised to units of S/N) for different ways of combining the individual data sets. In each case, the black dashed line represents the result when combining all the data together. Top left: orange lines are the CCFs from each individual observation taken in the L3262 setting. The red line is the combination of all L3262 observations. No dramatic improvement in S/N is acquired from this combination. Top right: same, but for the case of L3340. Middle left: same, for the case of L3426. Middle right: same, for the case of M4318. Bottom: here, a set of single observations from each spectral setting is plotted as orange lines. Their combination is plotted as a red line. In this case, a significant improvement is gained from combining the data sets, almost reaching the S/N level from the full data set.
Current usage metrics show cumulative count of Article Views (full-text article views including HTML views, PDF and ePub downloads, according to the available data) and Abstracts Views on Vision4Press platform.
Data correspond to usage on the plateform after 2015. The current usage metrics is available 48-96 hours after online publication and is updated daily on week days.
Initial download of the metrics may take a while.