Fig. 8
Download original image
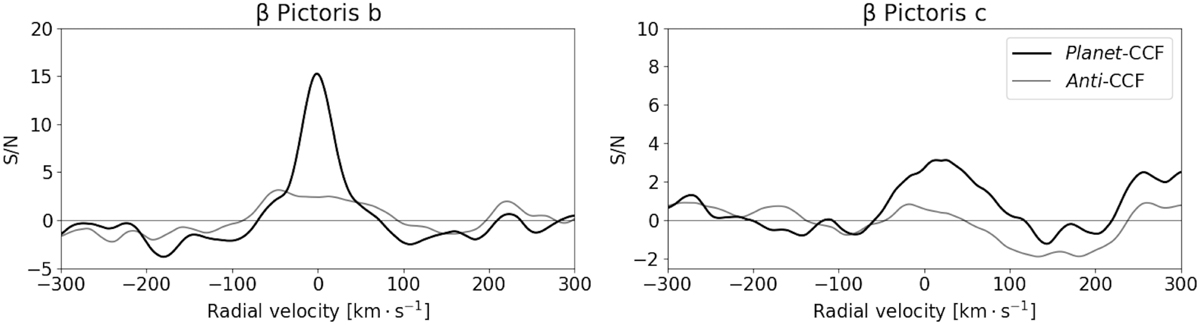
Cross-correlation functions of β Pic b (left) and c (right). The black lines are the cross-correlation functions at the locations of the planets, while the grey lines are the corresponding functions at the exact opposite side of the star relative to the planets. Note the different scaling on the y-axes between the two panels. Planet b is clearly detected, while planet c shows a bump that can only be seen as a tentative feature.
Current usage metrics show cumulative count of Article Views (full-text article views including HTML views, PDF and ePub downloads, according to the available data) and Abstracts Views on Vision4Press platform.
Data correspond to usage on the plateform after 2015. The current usage metrics is available 48-96 hours after online publication and is updated daily on week days.
Initial download of the metrics may take a while.