Fig. 7
Download original image
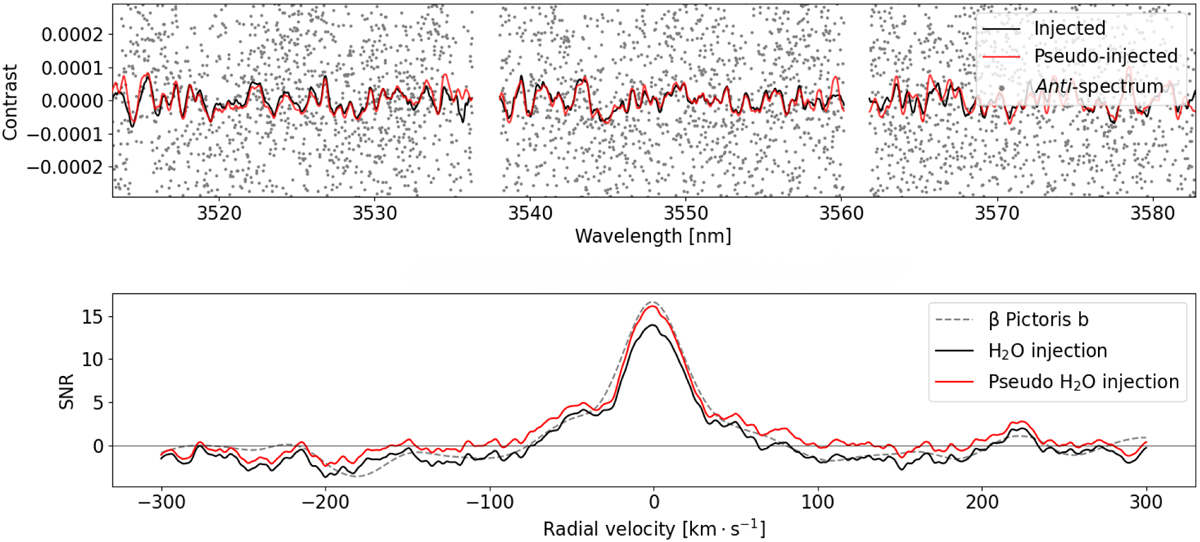
Comparison of the signal injection scheme compared to the faster ‘pseudo-injection’ scheme described in Sect. 3.4. Top: direct comparison of the injected spectra using regular injection (black line) and pseudo-injection (red line). Also shown as grey dots are extracted spectral points at the location of the injection. Bottom: CCF outputs using injection (black line) and pseudo-injection (red line), compared to the actual water CCF for planet b (dashed line). The injection and pseudo-injection are both well representative of the real signal.
Current usage metrics show cumulative count of Article Views (full-text article views including HTML views, PDF and ePub downloads, according to the available data) and Abstracts Views on Vision4Press platform.
Data correspond to usage on the plateform after 2015. The current usage metrics is available 48-96 hours after online publication and is updated daily on week days.
Initial download of the metrics may take a while.