Fig. 3
Download original image
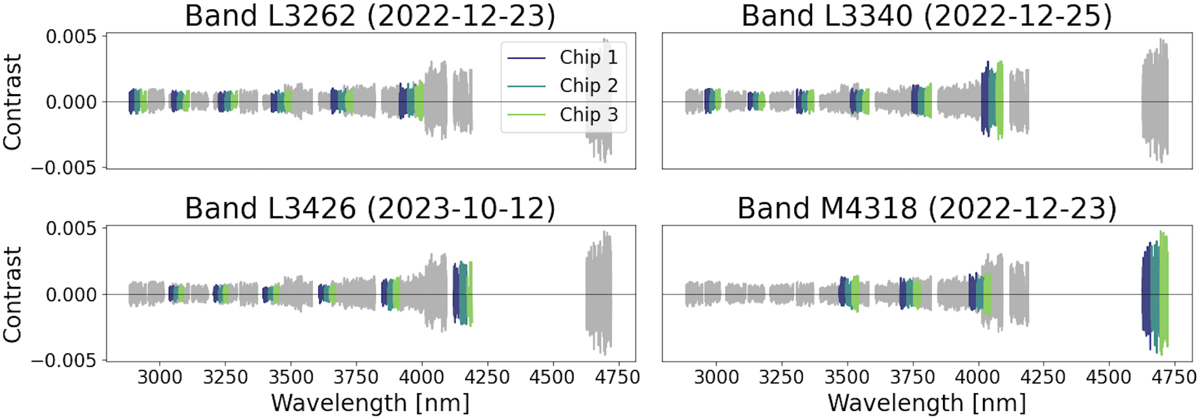
Spectral coverage of the observations in this study. Four spectral settings were used: L3262 (upper left), L3340 (upper right), L3426 (lower left) and M4318 (lower right). The coloured regions show the coverage of that particular setting, while the grey regions show the coverage of the other settings. The scatter corresponds to the noise level in each spectral region. Higher scatter can be caused by shorter integration time, worse ambient conditions, or lower instrumental transmission, but here it primarily reflects wavelength ranges of higher thermal background, and/or wavelength ranges of lower atmospheric transmission.
Current usage metrics show cumulative count of Article Views (full-text article views including HTML views, PDF and ePub downloads, according to the available data) and Abstracts Views on Vision4Press platform.
Data correspond to usage on the plateform after 2015. The current usage metrics is available 48-96 hours after online publication and is updated daily on week days.
Initial download of the metrics may take a while.