Fig. 2
Download original image
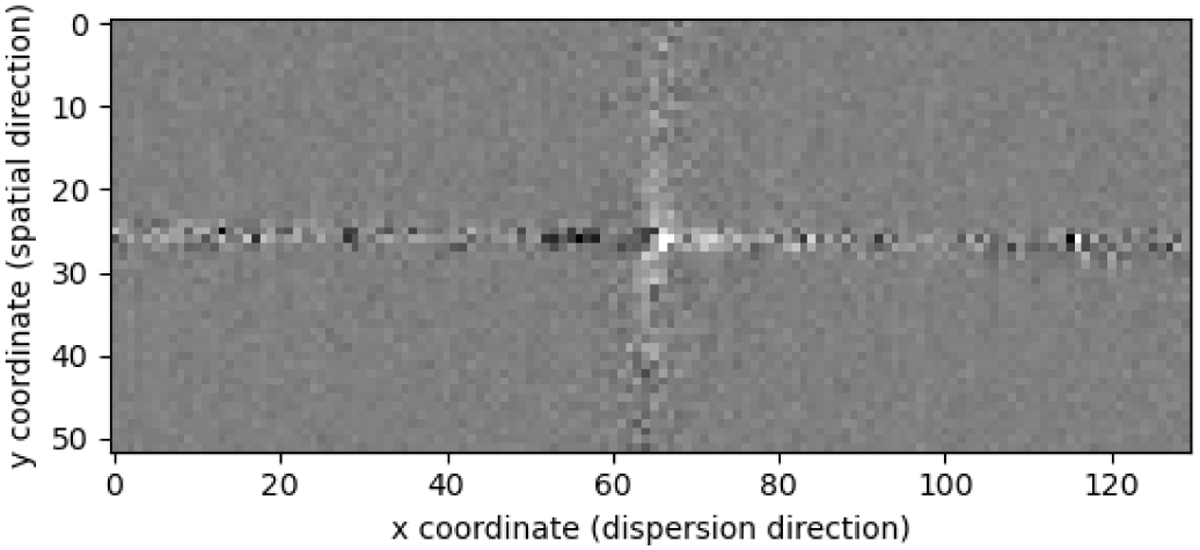
Example of residual data after PSF subtraction. The figure is in detector xy-space, since it can then be plotted as a non-interpolated pixeled image. Spatially (vertically), the image is centred on the stellar trace, which after PSF subtraction only remains as a narrow horizontal region of increased noise. Spectrally (horizontally), the image is centred on a strong telluric absorption feature. In this particular region, the PSF subtraction does not perform as well as along the rest of the spectrum, resulting in a vertical net positive feature extending out from the centre. At even larger separations vertically from the centre, the noise in the telluric region is generally enhanced. This feature would remain even if the PSF subtraction had been perfect, since it represents the much lower transmission inside of the telluric line than in the continuum. Planet b is ~9.5 pixels below the stellar trace, but cannot be seen without crosscorrelation techniques.
Current usage metrics show cumulative count of Article Views (full-text article views including HTML views, PDF and ePub downloads, according to the available data) and Abstracts Views on Vision4Press platform.
Data correspond to usage on the plateform after 2015. The current usage metrics is available 48-96 hours after online publication and is updated daily on week days.
Initial download of the metrics may take a while.