Fig. B.1
Download original image
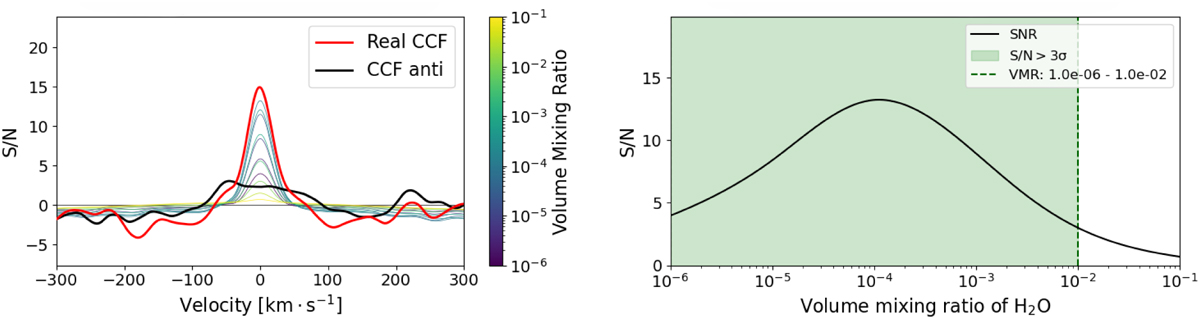
Left: CCFs in units of S /N for H2O in the atmosphere of β Pic b. Thick red line: Actual CCF for the location of the planet. Thick black line: CCF for the location at the opposite side of the star. Thin lines: CCF for injected H2O, colour coded by different volume mixing ratios as shown in the colour bar. Right: S /N of injected signals as function of VMR. The green shaded area shows at which range of VMRs the molecule would have been marginally detectable.
Current usage metrics show cumulative count of Article Views (full-text article views including HTML views, PDF and ePub downloads, according to the available data) and Abstracts Views on Vision4Press platform.
Data correspond to usage on the plateform after 2015. The current usage metrics is available 48-96 hours after online publication and is updated daily on week days.
Initial download of the metrics may take a while.