Fig. A.1
Download original image
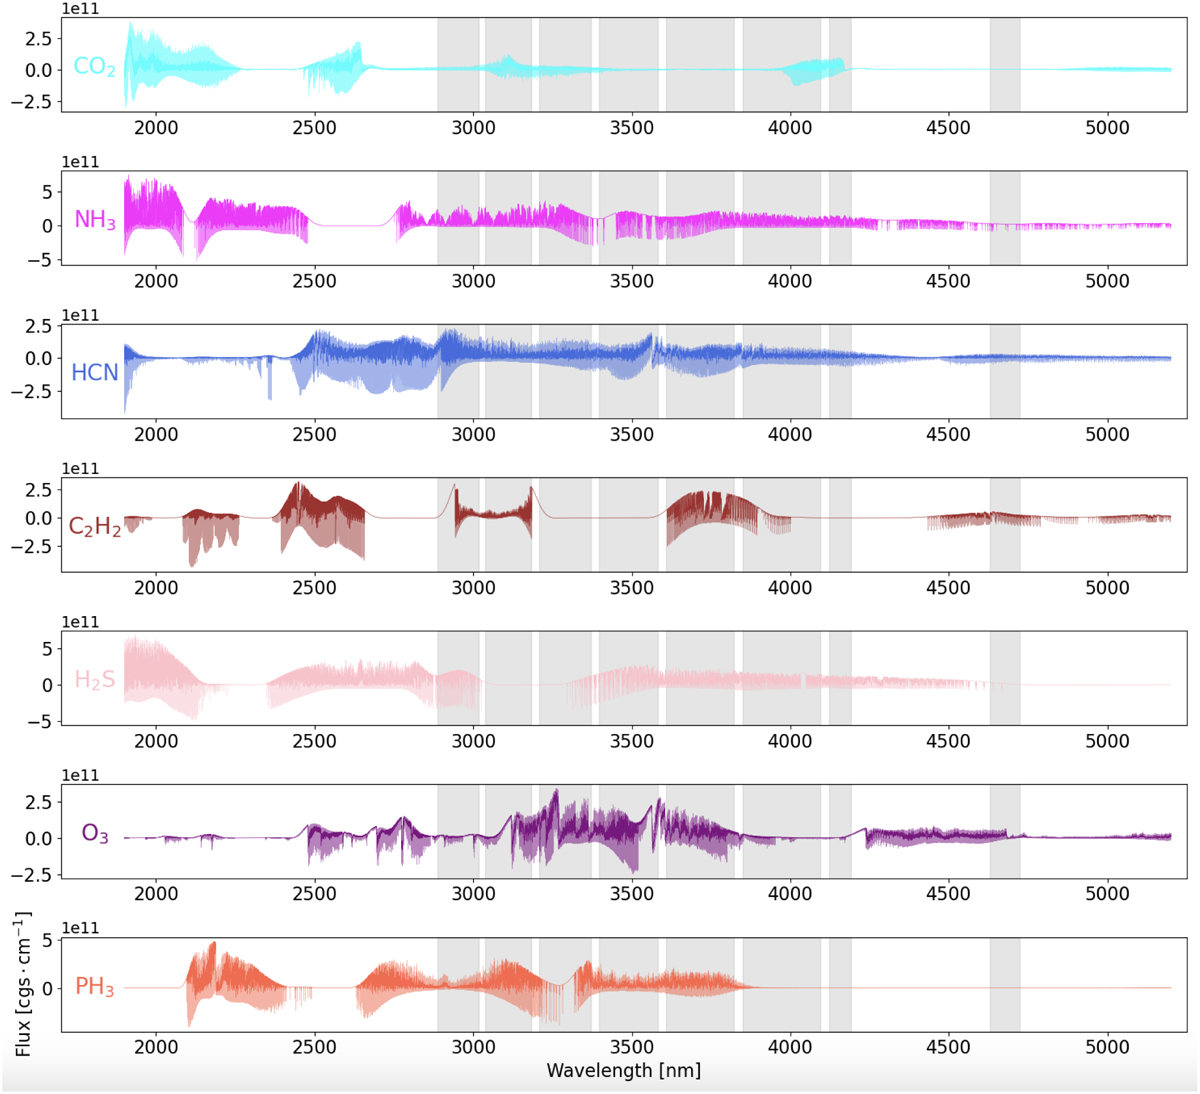
Theoretical spectra after continuum subtraction of molecules that we have searched for in the cross-correlation analysis. A similar figure for H2O, CO, CH4 and SiO is shown in the main text, Fig. 6. From top to bottom, the additional molecules shown here are CO2 in cyan, NH3 in magenta, HCN in light blue, C2H2 in dark red, H2S in pink, O3 in purple, and PH3 in orange. Grey areas correspond to the wavelength windows covered by our observations.
Current usage metrics show cumulative count of Article Views (full-text article views including HTML views, PDF and ePub downloads, according to the available data) and Abstracts Views on Vision4Press platform.
Data correspond to usage on the plateform after 2015. The current usage metrics is available 48-96 hours after online publication and is updated daily on week days.
Initial download of the metrics may take a while.