Fig. 1
Download original image
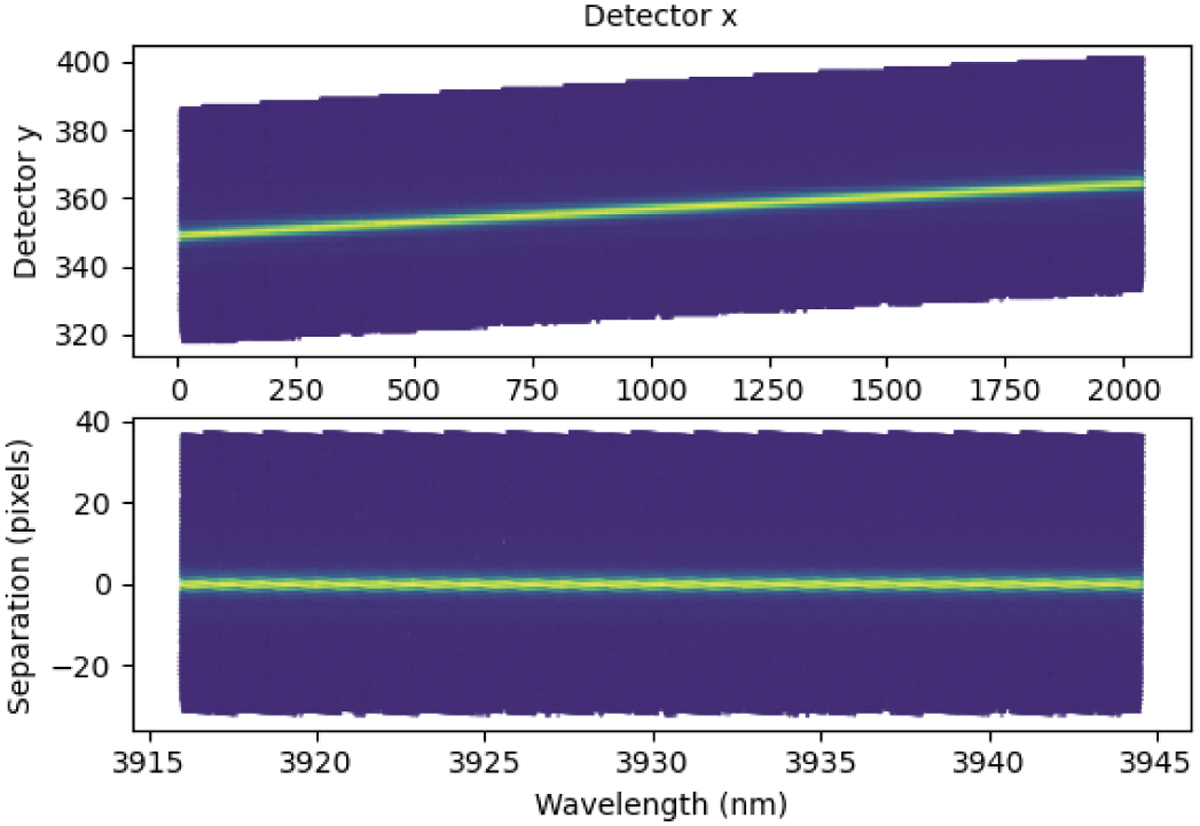
Flux-normalised spectral traces of the star β Pic, for one single spectral chunk. The panels are not plotted as pixeled images (which would not be possible for the bottom panel, since it is not uniformly sampled), but as one coloured dot per sampled data point. Yellow is a normalised flux of 1, blue is 0. Top panel: flux sampled by the xi and yi coordinates on the detector. Bottom panel: the same flux (no interpolation) sampled by wavelength λi and separation ρi.
Current usage metrics show cumulative count of Article Views (full-text article views including HTML views, PDF and ePub downloads, according to the available data) and Abstracts Views on Vision4Press platform.
Data correspond to usage on the plateform after 2015. The current usage metrics is available 48-96 hours after online publication and is updated daily on week days.
Initial download of the metrics may take a while.