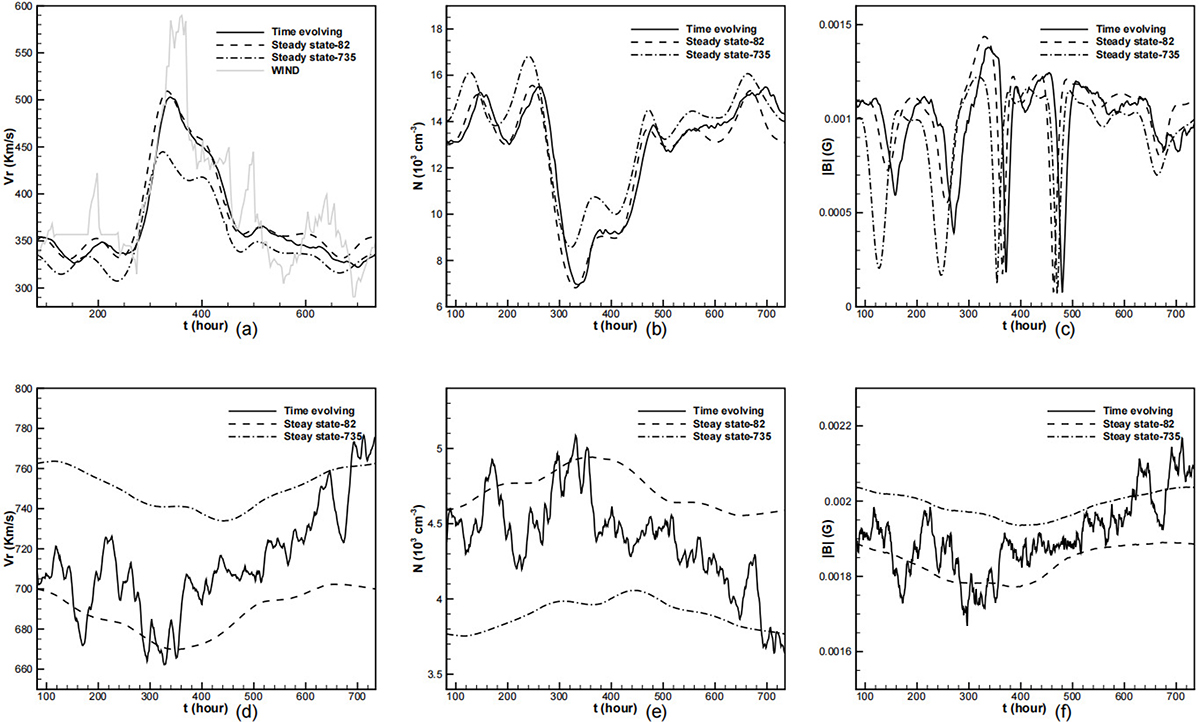
Fig. 6.
Download original image
Timing diagram of simulated radial velocity, Vr, in km s−1 (a, d), proton number density in units of 103 cm−3 (b, e), and magnetic field strength in unit of Gauss (c, f) observed by two virtual satellites located at the HDLS (a, b, c) and LDHS (d, e, f) regions. The solid black lines denote variables observed at (r,θ,ϕ) = (20 Rs,0,201°) and (r,θ,ϕ) = (20 Rs,−70°,201°) during the 82nd and 735th hours of the time-evolving coronal simulation. For the quasi-steady-state coronal simulations constrained by magnetograms at 82 (denoted by dashed black lines) and 735 (denoted by dash-dot black lines) of this time interval, the heliolongitude is mapped to a CR period corresponding to the time series on the horizontal axis of the timing diagram. The solid grey line (a) denotes the velocity observed by the WIND satellite and mapped from 1 AU to 20 Rs following the ballistic propagation.
Current usage metrics show cumulative count of Article Views (full-text article views including HTML views, PDF and ePub downloads, according to the available data) and Abstracts Views on Vision4Press platform.
Data correspond to usage on the plateform after 2015. The current usage metrics is available 48-96 hours after online publication and is updated daily on week days.
Initial download of the metrics may take a while.