Fig. 4.
Download original image
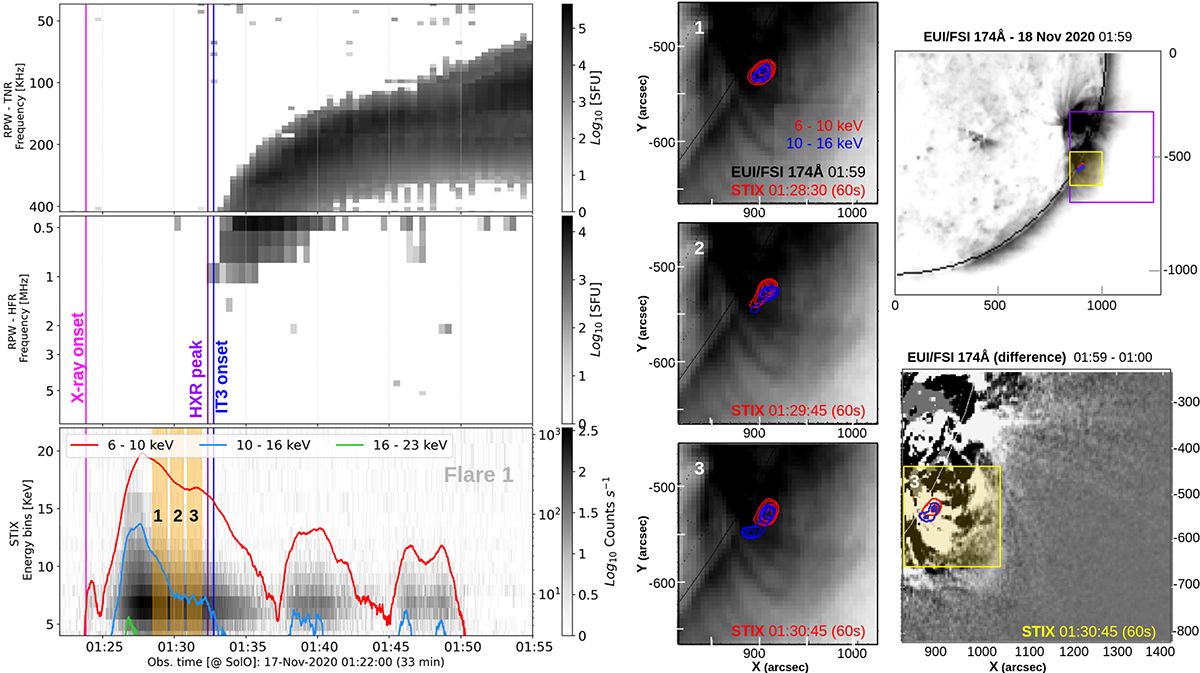
Observations of X-ray and radio emissions of a solar flare on November 17 ∼ 01:25 UT as seen by STIX and RPW (flare 1 in Table A.1). (left) The plots from top to bottom correspond to RPW/TNR (40–425 kHz) and RPW/HFR (from 425 kHz to 8 MHz) spectrograms and STIX count rate spectrogram with light curves of different energy ranges overlayed (4–10, 10–16 and 16–23 keV in red, blue and green respectively). The X-ray flare onset time, the IP type III burst onset time and the time of the associated X-ray peak are marked with vertical lines in magenta, blue, and purple. (center) The sequence of images 1, 2 and 3 correspond to the X-ray imaging of the selected time intervals. For each of them, a EUI/FSI image in the 174 Å band (dark is enhanced emission) is shown with the hard X-ray emission contours overlaid. The contour levels are at 30%, 50%, 70%, and 90%. The integration time (in seconds) used for doing each STIX image is indicated. (right) On the bottom, a zoom of the HXR imaging of interval 3 is overlayed on a running EUI difference image (areas with enhanced emission in the second image relative to the first one appear brighter). In the top image (EUV image of the active region), the frames used for the running difference image (purple frame) and the STIX image of interval 3 (yellow frame) are highlighted.
Current usage metrics show cumulative count of Article Views (full-text article views including HTML views, PDF and ePub downloads, according to the available data) and Abstracts Views on Vision4Press platform.
Data correspond to usage on the plateform after 2015. The current usage metrics is available 48-96 hours after online publication and is updated daily on week days.
Initial download of the metrics may take a while.