Fig. 3.
Download original image
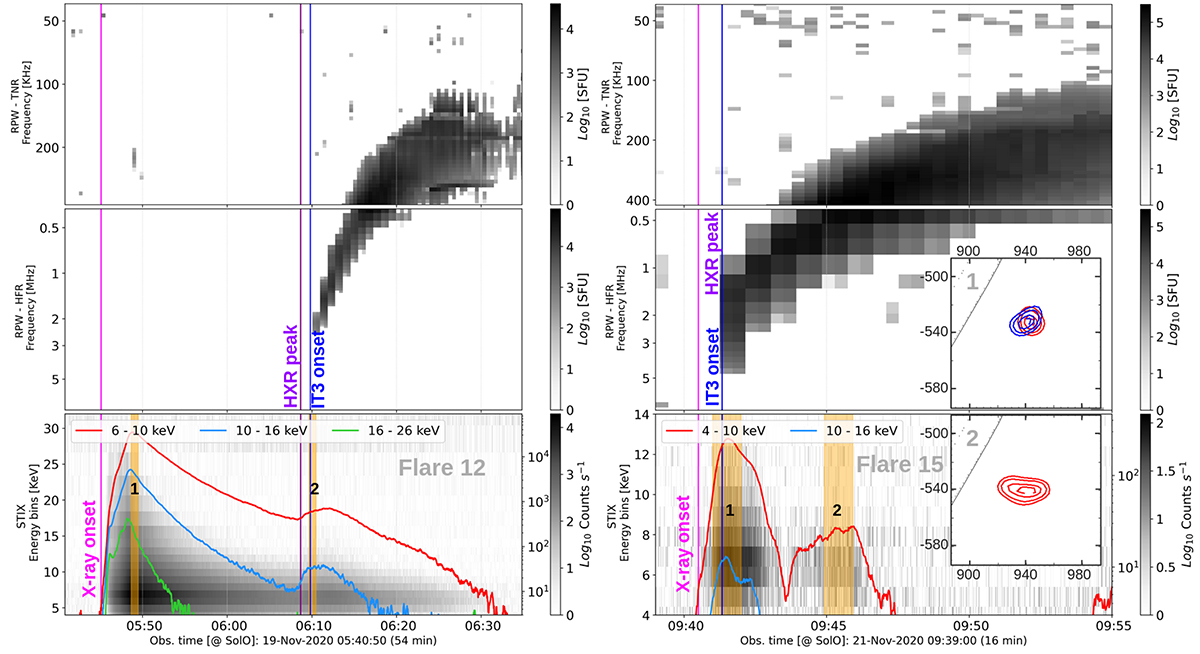
Examples of two events with a good association between type III radio bursts and X-ray emissions observed on 19 and 21 November 2020 (Flares 12 and 15, respectively). The plots from top to bottom correspond to RPW-TNR spectrograms (40–425 kHz), RPW-HFR spectrograms (from 425 kHz up to 8 MHz), and STIX count rate spectrograms with overlayed light curves of the 6–10, 10–16, and 16–26 keV energy ranges (red, blue, and green, respectively). X-ray images are produced for two time intervals (highlighted in orange) of each example. The images of flare 12 are shown in Figure 2.
Current usage metrics show cumulative count of Article Views (full-text article views including HTML views, PDF and ePub downloads, according to the available data) and Abstracts Views on Vision4Press platform.
Data correspond to usage on the plateform after 2015. The current usage metrics is available 48-96 hours after online publication and is updated daily on week days.
Initial download of the metrics may take a while.