Fig. 2.
Download original image
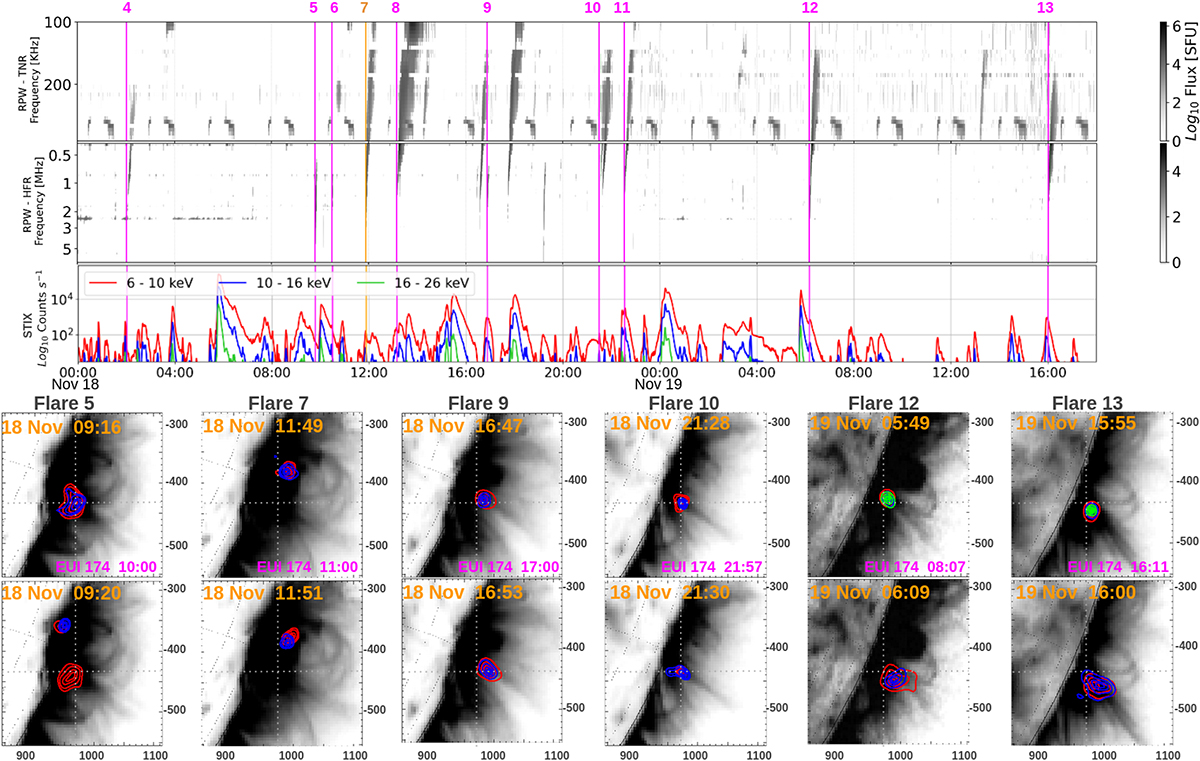
Overview of RPW/STIX observations for a 40-hour time interval from November 18 at 00:00 UT to November 19 at 18:00 UT. (Top) From top to bottom, the panels correspond to RPW-TNR spectrograms (100–425 kHz), RPW-HFR spectrograms (from 425 kHz up to 8 MHz), and STIX count rate light curves at low energy (6–10 keV, red) and high energy (10–16 keV, blue; 16–26 keV, green) ranges. The vertical lines indicate the time of type III onsets in our sample (the associated flare ID number is shown above the radio spectrograms). (Bottom) For six selected flares within this interval, X-ray contours in two energy bands are overlaid on EUV images provided by the EUI in the 174 Å band. Contours are shown for the same energy ranges as the light curves on the STIX count rate plot; the color-coding per energy range is the same as in the top panels.
Current usage metrics show cumulative count of Article Views (full-text article views including HTML views, PDF and ePub downloads, according to the available data) and Abstracts Views on Vision4Press platform.
Data correspond to usage on the plateform after 2015. The current usage metrics is available 48-96 hours after online publication and is updated daily on week days.
Initial download of the metrics may take a while.