Fig. 3
Download original image
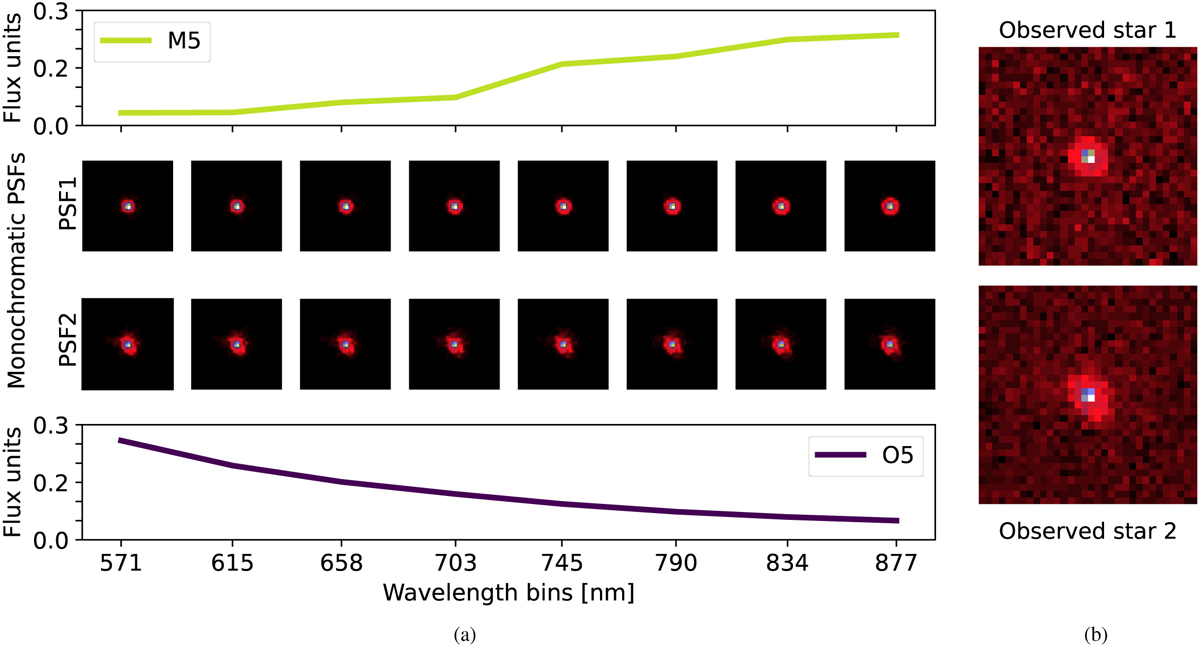
Ilustrative example of the degeneracy between the PSF size and spectral type of stars. (a) Middle rows: monochromatic PSFs for two positions in the FOV. The PSFs are shown for eight equally spaced wavelength values. Top and bottom: eight-bin spectral energy distribution of two stars, a M5 star (top) and an O5 star (bottom), located at positions 1 and 2 respectively. The wavelength axis is shared between all rows. (b) Observation of the respective stars.
Current usage metrics show cumulative count of Article Views (full-text article views including HTML views, PDF and ePub downloads, according to the available data) and Abstracts Views on Vision4Press platform.
Data correspond to usage on the plateform after 2015. The current usage metrics is available 48-96 hours after online publication and is updated daily on week days.
Initial download of the metrics may take a while.