Fig. 12
Download original image
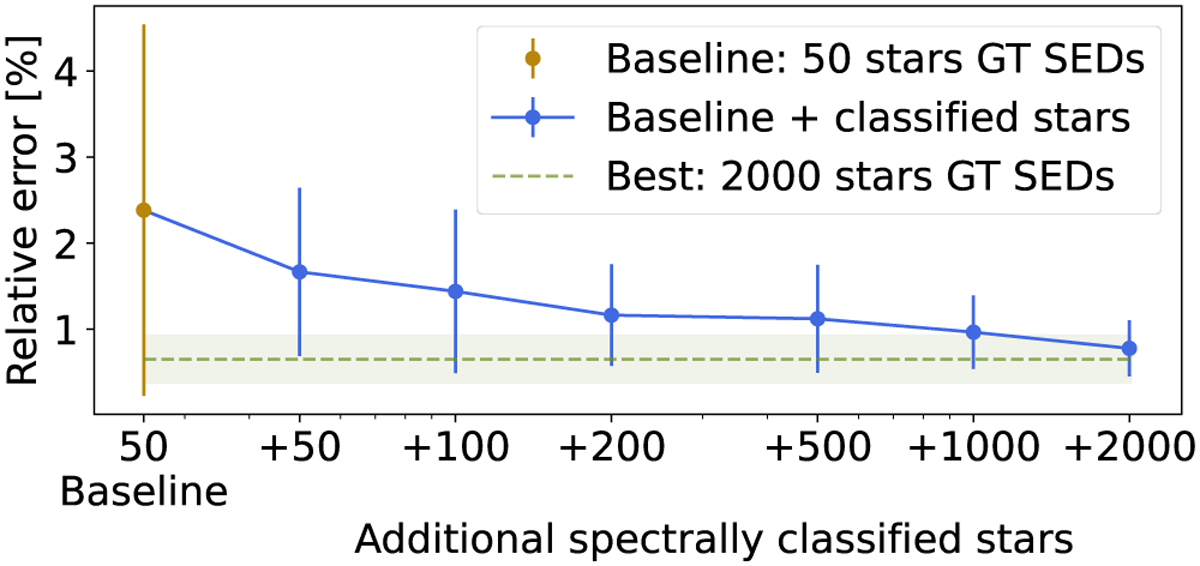
Relative PSF error, at observation resolution, as a function of the number of training stars. The baseline is set to the performance of the approximate PSF trained with 50 stars and ground truth SEDs (dark yellow). The subsequent PSF models (blue points) are trained using the 50 baseline stars in addition to increasing numbers of stars with SEDs assigned by our PSF-aware classifier. The error bars represent the standard deviation of the relative errors of the test dataset. The green dashed line shows the idealised minimum relative PSF error that can be obtained when using 2000 stars with ground truth SEDs, and the green shaded area represents the standard deviation of the relative errors.
Current usage metrics show cumulative count of Article Views (full-text article views including HTML views, PDF and ePub downloads, according to the available data) and Abstracts Views on Vision4Press platform.
Data correspond to usage on the plateform after 2015. The current usage metrics is available 48-96 hours after online publication and is updated daily on week days.
Initial download of the metrics may take a while.