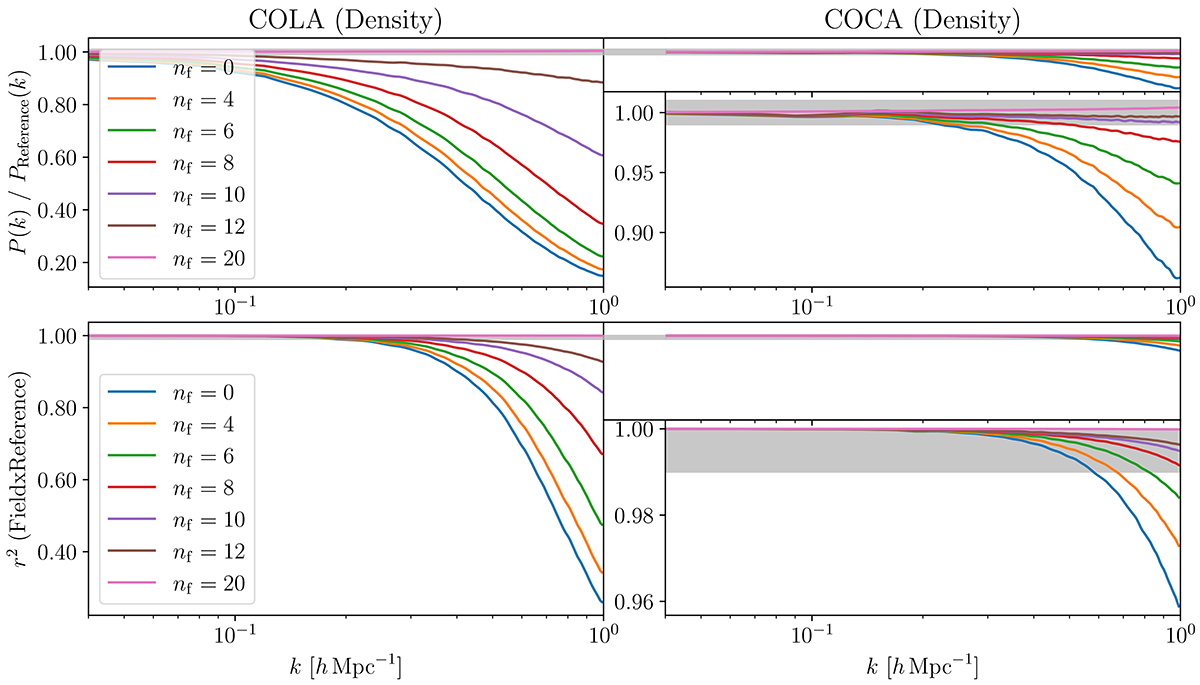
Fig. 8.
Download original image
Ratio of the matter power spectrum (top row) and the cross-correlation (bottom row) with respect to the reference simulation, for COLA (left column) and COCA (right column) simulations with varying numbers of force evaluations, nf. The coloured lines represent the mean over the test set. In the COCA column, the top panel of each row is plotted on the same scale as COLA, while the lower panel provides a zoomed-in version. The grey band indicates 1% agreement with the reference. COCA simulations are much closer to the reference even when using far fewer force evaluations, and the agreement improves as nf increases.
Current usage metrics show cumulative count of Article Views (full-text article views including HTML views, PDF and ePub downloads, according to the available data) and Abstracts Views on Vision4Press platform.
Data correspond to usage on the plateform after 2015. The current usage metrics is available 48-96 hours after online publication and is updated daily on week days.
Initial download of the metrics may take a while.