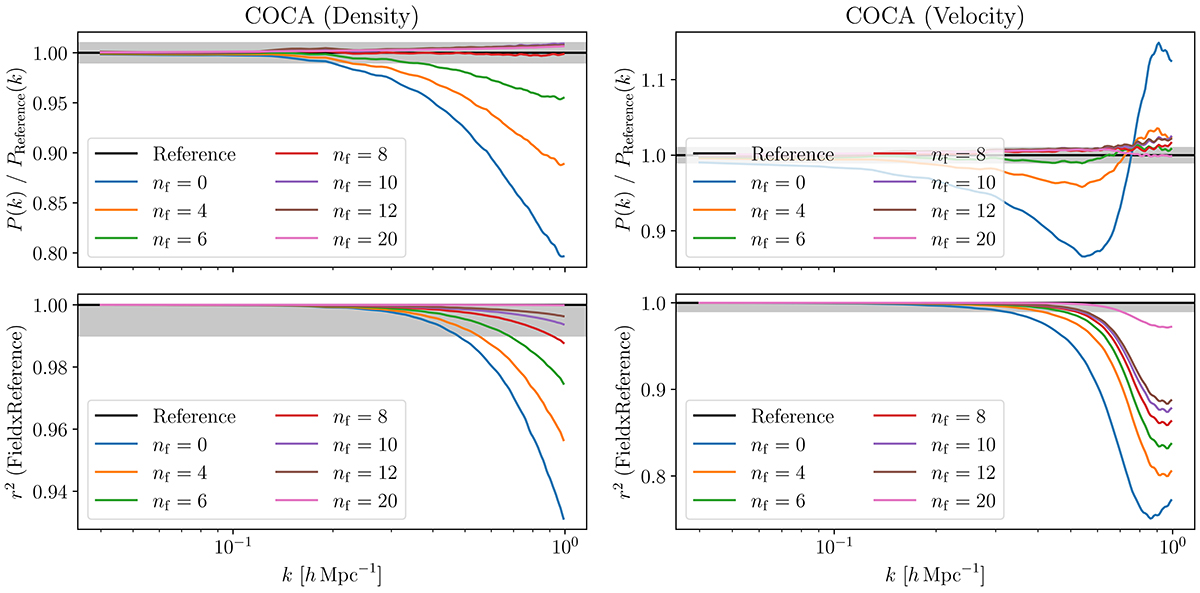
Fig. 11.
Download original image
Performance of the COCA framework when applied outside the range of the training data. We compare the power spectrum (top row) and cross-correlation coefficient (bottom row) of the matter density field (left column) and velocity potential (right column) when using our emulator with a different set of cosmological parameters than it was trained on. The coloured lines show the mean across 50 test simulations as a function of the number of force evaluations, nf. The grey band indicates 99% agreement. In this test of robustness to cosmological parameter mis-specification, only eight force evaluations are required to correct the emulation error up to k ≳ 0.6 h Mpc−1.
Current usage metrics show cumulative count of Article Views (full-text article views including HTML views, PDF and ePub downloads, according to the available data) and Abstracts Views on Vision4Press platform.
Data correspond to usage on the plateform after 2015. The current usage metrics is available 48-96 hours after online publication and is updated daily on week days.
Initial download of the metrics may take a while.