Fig. B.1.
Download original image
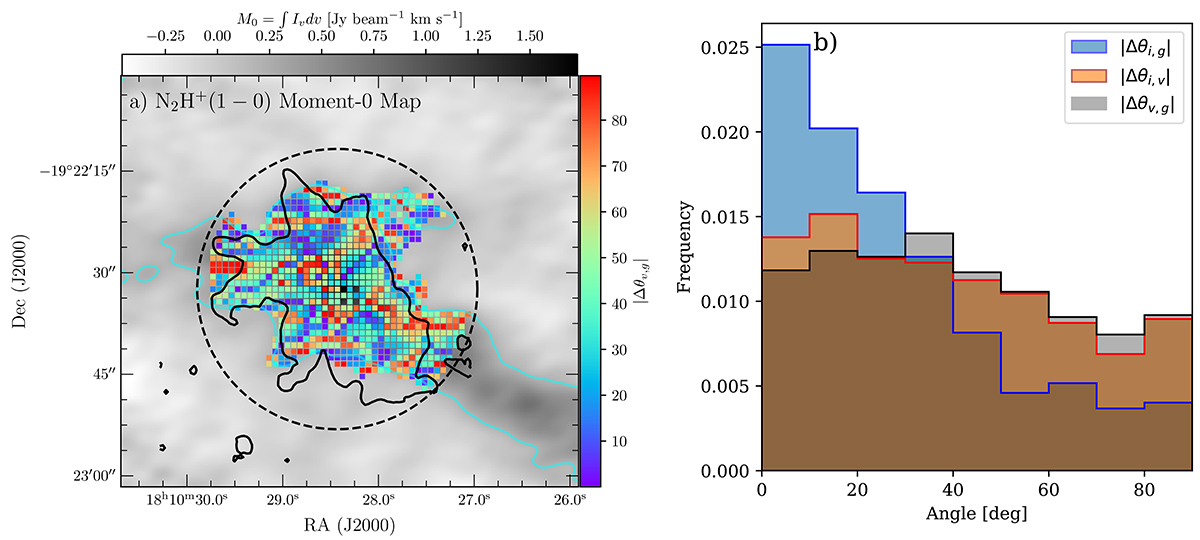
Distribution of relative orientation between gravity (g), velocity gradient (v), and intensity gradient (i) vectors. a) Spatial distribution of relative orientation between g and v vectors (in color) overlaid on the N2H+ moment-0 map. b) Histogram distribution of relative orientation between g, v, and i vectors toward circular region marked in panel (a). Black and cyan contours are same as the contours shown in Fig. A.2c, and Fig. A.2e, respectively.
Current usage metrics show cumulative count of Article Views (full-text article views including HTML views, PDF and ePub downloads, according to the available data) and Abstracts Views on Vision4Press platform.
Data correspond to usage on the plateform after 2015. The current usage metrics is available 48-96 hours after online publication and is updated daily on week days.
Initial download of the metrics may take a while.