Open Access
Fig. A.3.
Download original image
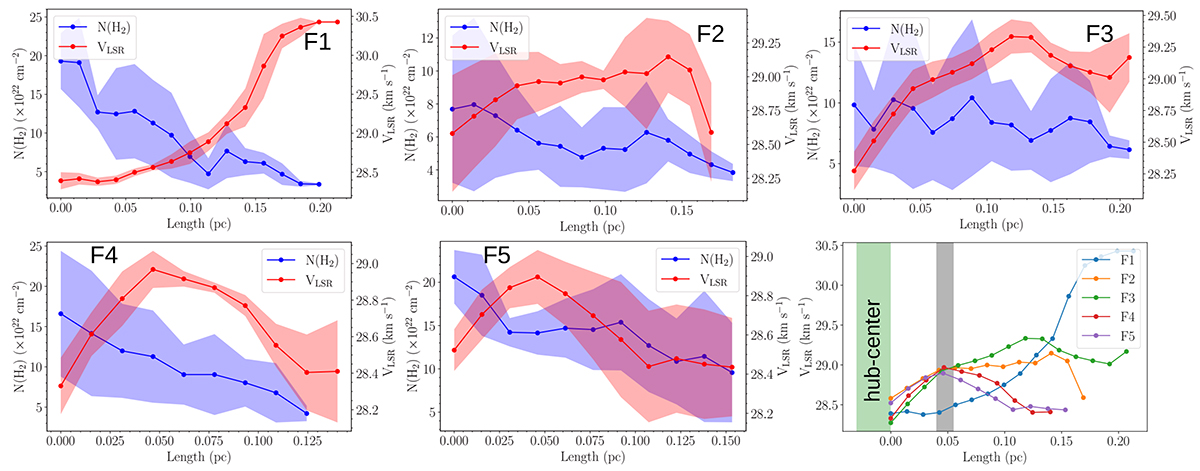
Distribution of N(H2) and VLSR along the five filaments (F1–F5), from the head (or hub) to the tail (see boxes in Fig. A.2c). The shaded regions are the same as in Fig. 4. The bottom-right panel shows the VLSR profiles of all filaments. Shadowed regions mark the hub center, and the position ranges from 0.04 to 0.055 pc.
Current usage metrics show cumulative count of Article Views (full-text article views including HTML views, PDF and ePub downloads, according to the available data) and Abstracts Views on Vision4Press platform.
Data correspond to usage on the plateform after 2015. The current usage metrics is available 48-96 hours after online publication and is updated daily on week days.
Initial download of the metrics may take a while.