Fig. A.2.
Download original image
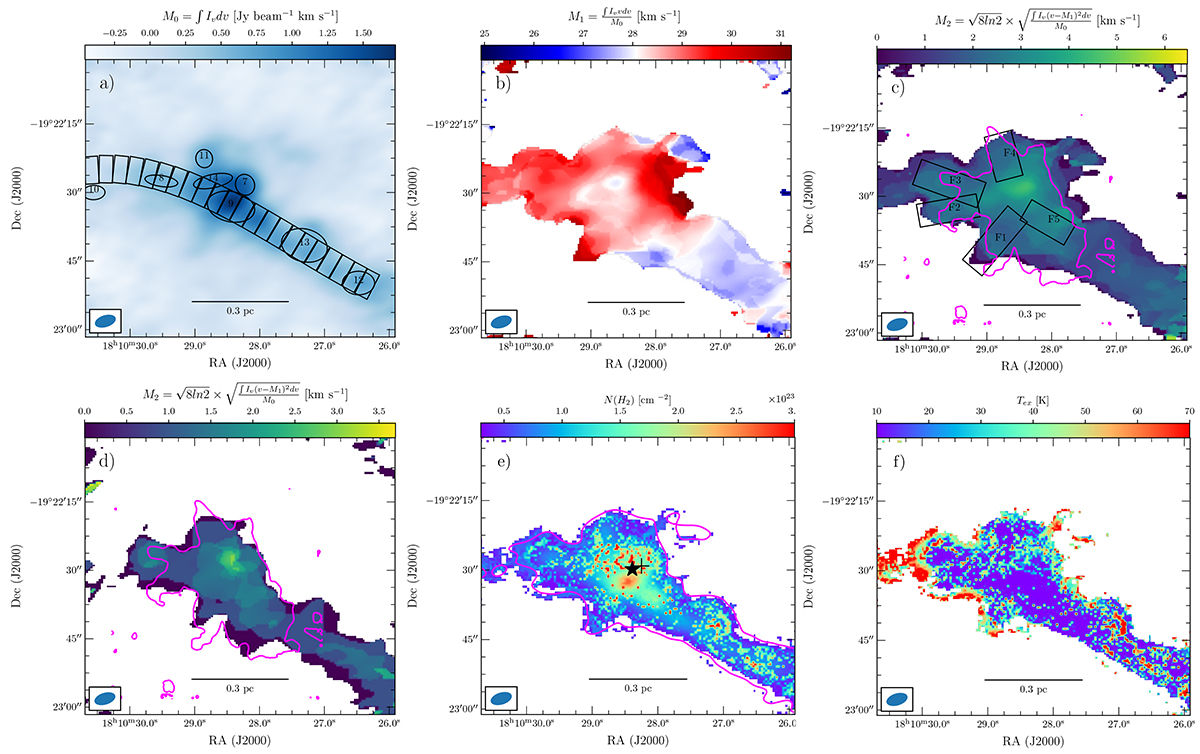
(a–c) Moment-0/1/2 maps of N2H+(1–0) emission derived using central peak (see shaded area in A.1a). d) Moment-2 map of N2H+(1–0) emission made using singlet F1 F = 01–12. e) H2 column density and f) excitation temperature maps. In panel (e), overlaid contour is of N2H+(1–0) integrated emission at the level of 0.2 Jy beam−1 km s−1. The star and cross symbols are same as shown in Fig. 1. The apertures of identified cores, and a rectangular strip are overlaid in panel (a). In panel (c), rectangular boxes mark areas of hub-composing filaments (F1-F5). A contour in panels (c) and (d) displays structure traced by the JWST (see Fig. 1c).
Current usage metrics show cumulative count of Article Views (full-text article views including HTML views, PDF and ePub downloads, according to the available data) and Abstracts Views on Vision4Press platform.
Data correspond to usage on the plateform after 2015. The current usage metrics is available 48-96 hours after online publication and is updated daily on week days.
Initial download of the metrics may take a while.