Fig. A.1.
Download original image
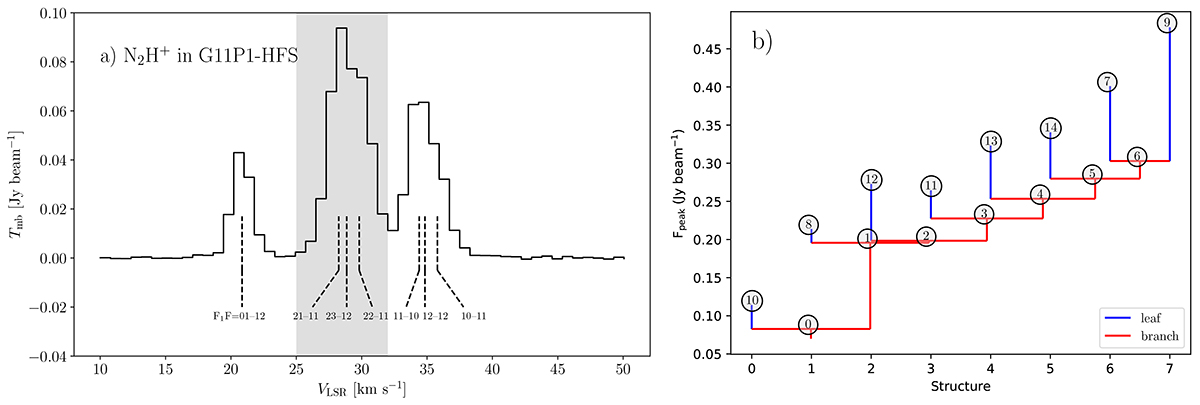
a) N2H+(1–0) spectrum averaged over the G11P1-HFS region (see the larger circle in Fig. 3). The seven hyperfine components are labeled. The shaded region shows the central peak with VLSR ranging from 25 to 32 km s−1, which is used for the gas kinematics study (Sec. 3.2). b) Dendrogram tree of N2H+(1–0) emission. The leaves and branches are marked (see also Fig. 3).
Current usage metrics show cumulative count of Article Views (full-text article views including HTML views, PDF and ePub downloads, according to the available data) and Abstracts Views on Vision4Press platform.
Data correspond to usage on the plateform after 2015. The current usage metrics is available 48-96 hours after online publication and is updated daily on week days.
Initial download of the metrics may take a while.