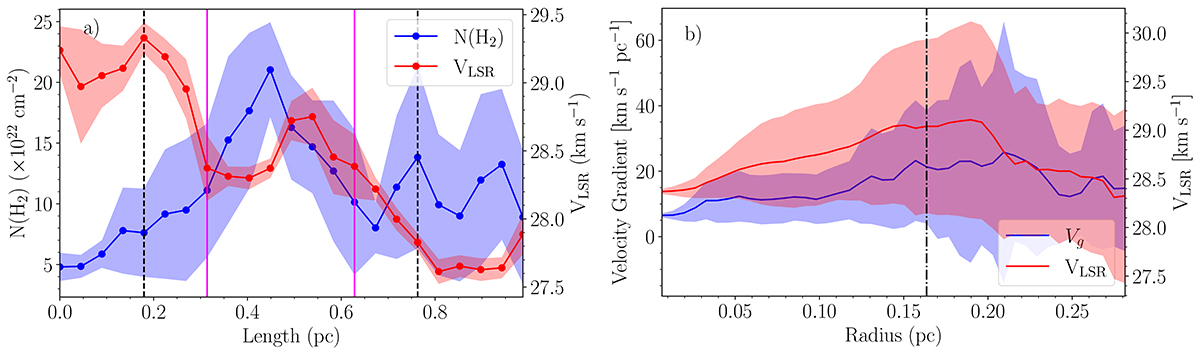
Fig. 4.
Download original image
Distribution of N(H2), VLSR, and Vg. (a) Distribution of N(H2) and VLSR along the rectangular strip shown in Fig. A.2a. The dots and shaded regions represent the mean and standard deviation range for each box in the strip. The dashed and solid vertical lines mark the boundary of two concentric circular regions shown in Fig. 3. (b) Radial plots for VLSR and Vg drawn from the center of concentric circles (Fig. 3). The vertical dotted-dashed line shows the boundary of the inner circle in Fig. 3.
Current usage metrics show cumulative count of Article Views (full-text article views including HTML views, PDF and ePub downloads, according to the available data) and Abstracts Views on Vision4Press platform.
Data correspond to usage on the plateform after 2015. The current usage metrics is available 48-96 hours after online publication and is updated daily on week days.
Initial download of the metrics may take a while.