Fig. 3.
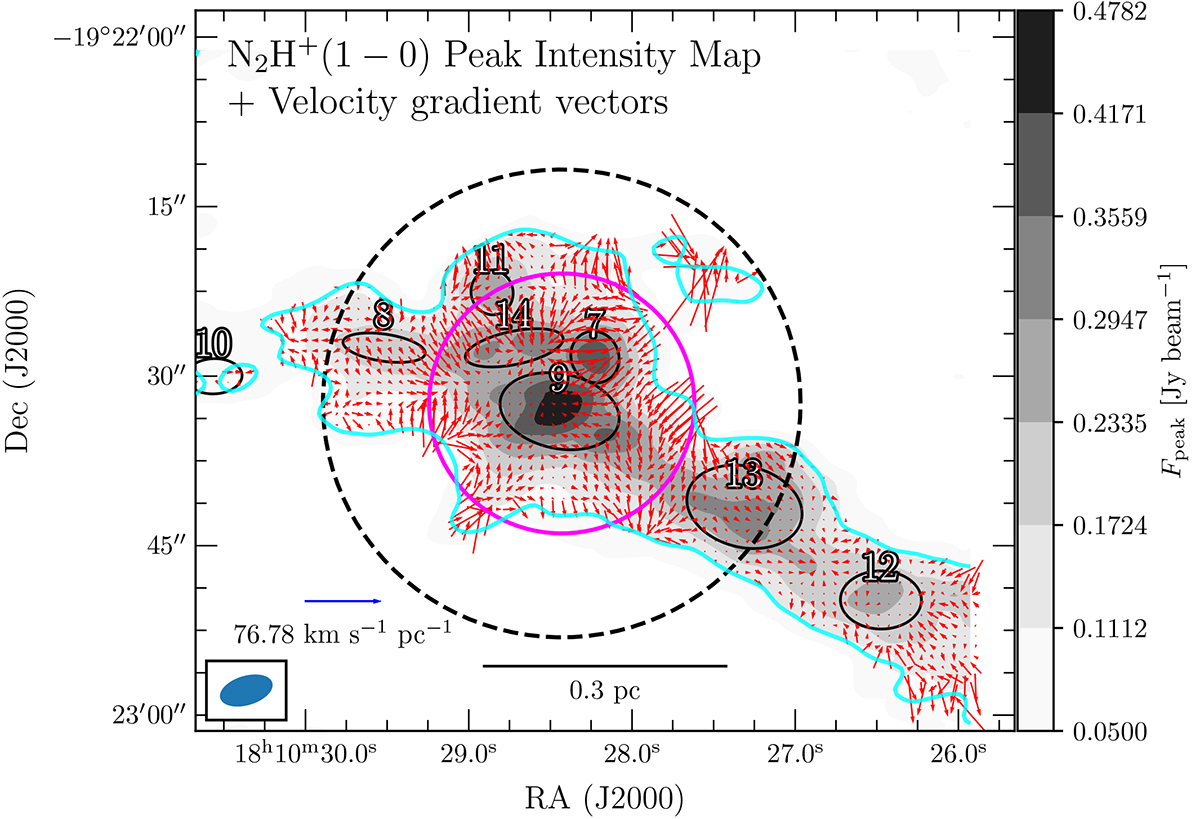
Download original image
Overlay of velocity gradient (Vg) vectors and dendrogram leaves on the N2H+(1–0) peak intensity map. The arrowheads point to local blueshifted velocity material. The reference Vg vector and ALMA beam are shown in the lower-left corner. The cyan contour presents the N2H+ emission at a level of 0.2 Jy beam−1 km s−1. Two circular regions, radii ∼12″ (∼0.17 pc) and 22″ (∼0.3 pc), typically mark the boundaries of the hub and G11P1-HFS (see text and Fig. 4).
Current usage metrics show cumulative count of Article Views (full-text article views including HTML views, PDF and ePub downloads, according to the available data) and Abstracts Views on Vision4Press platform.
Data correspond to usage on the plateform after 2015. The current usage metrics is available 48-96 hours after online publication and is updated daily on week days.
Initial download of the metrics may take a while.