Fig. B.1
Download original image
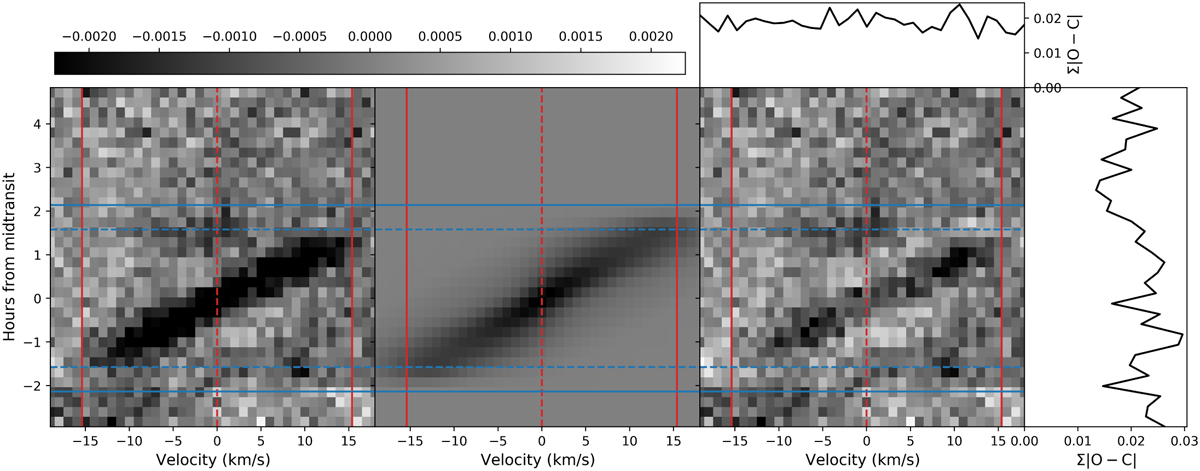
Doppler shadow analysis. Left: Doppler shadow of HAT-P-41 Ab as it appears in the observed data (depth is indicated by the upper, horizontal colorbar); middle: a best-fitting model of the Doppler shadow, right: residuals of the best-fitting model after subtraction from the actual data. The blue solid and dashed lines mark the boundaries for the full and total transit times, respectively.
Current usage metrics show cumulative count of Article Views (full-text article views including HTML views, PDF and ePub downloads, according to the available data) and Abstracts Views on Vision4Press platform.
Data correspond to usage on the plateform after 2015. The current usage metrics is available 48-96 hours after online publication and is updated daily on week days.
Initial download of the metrics may take a while.