Open Access
Fig. A.1
Download original image
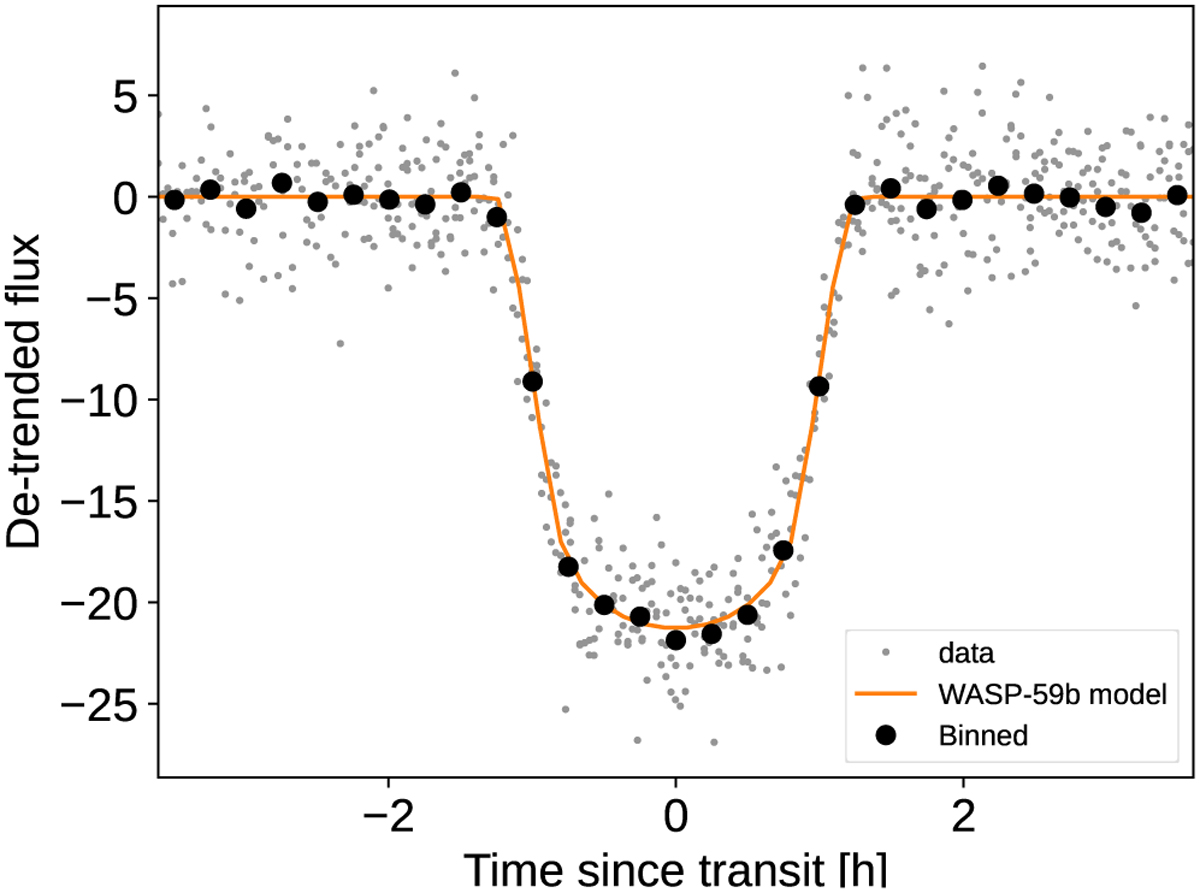
Phase curve of WASP-59b using TESS data centered around the primary transit. Observed data are shown in gray, binned data in black and the obtained transit model in orange color.
Current usage metrics show cumulative count of Article Views (full-text article views including HTML views, PDF and ePub downloads, according to the available data) and Abstracts Views on Vision4Press platform.
Data correspond to usage on the plateform after 2015. The current usage metrics is available 48-96 hours after online publication and is updated daily on week days.
Initial download of the metrics may take a while.