Open Access
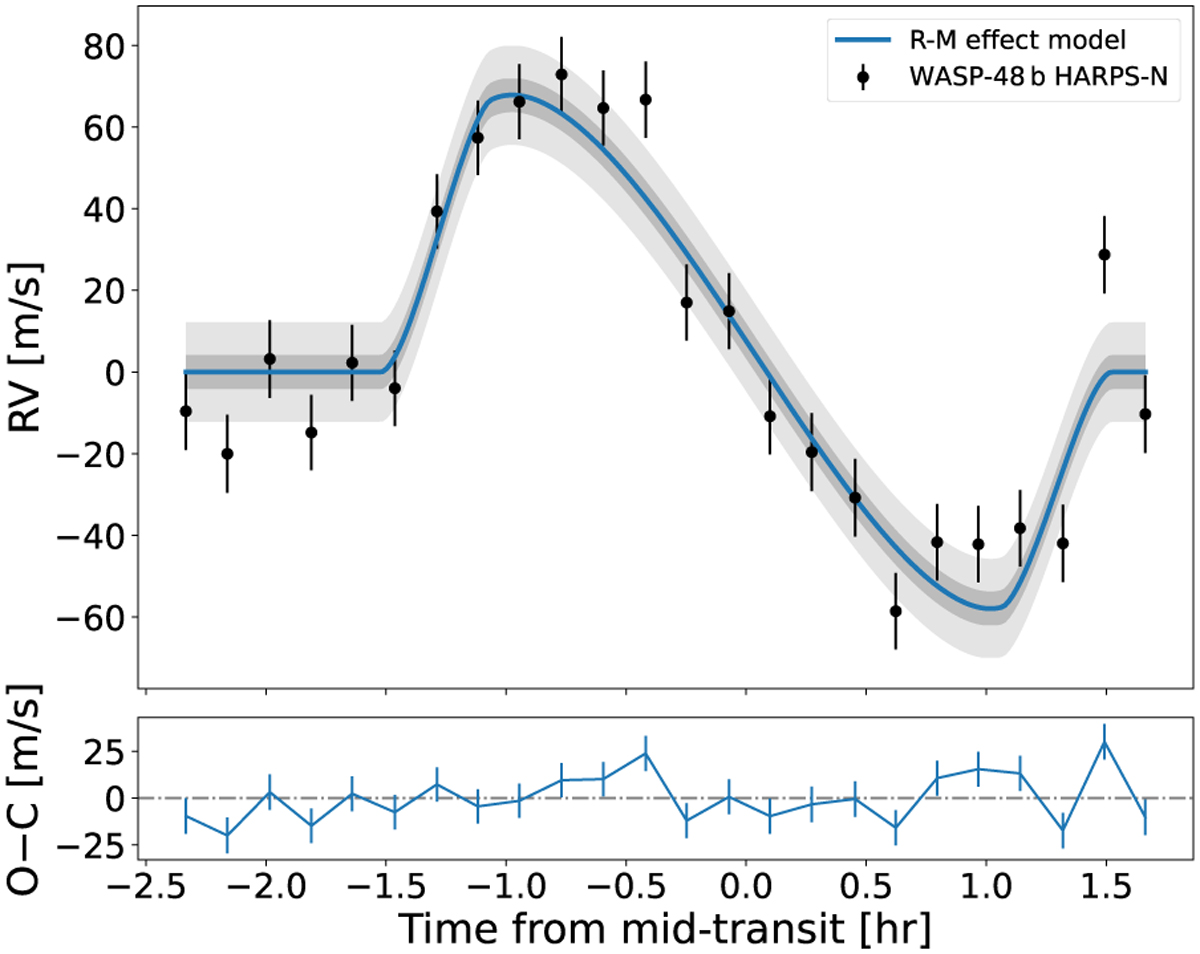
Fig. 1
Download original image
Rossiter–McLaughlin effect of WASP-48b observed with HARPS-N. The observed data points (black) are shown with their error bars. The systemic and Keplerian orbit velocities were removed. The blue line shows the best fitting model to the data, together with 1-σ (dark grey) and 3-σ (light grey) confidence intervals.
Current usage metrics show cumulative count of Article Views (full-text article views including HTML views, PDF and ePub downloads, according to the available data) and Abstracts Views on Vision4Press platform.
Data correspond to usage on the plateform after 2015. The current usage metrics is available 48-96 hours after online publication and is updated daily on week days.
Initial download of the metrics may take a while.