Open Access
Fig. 4
Download original image
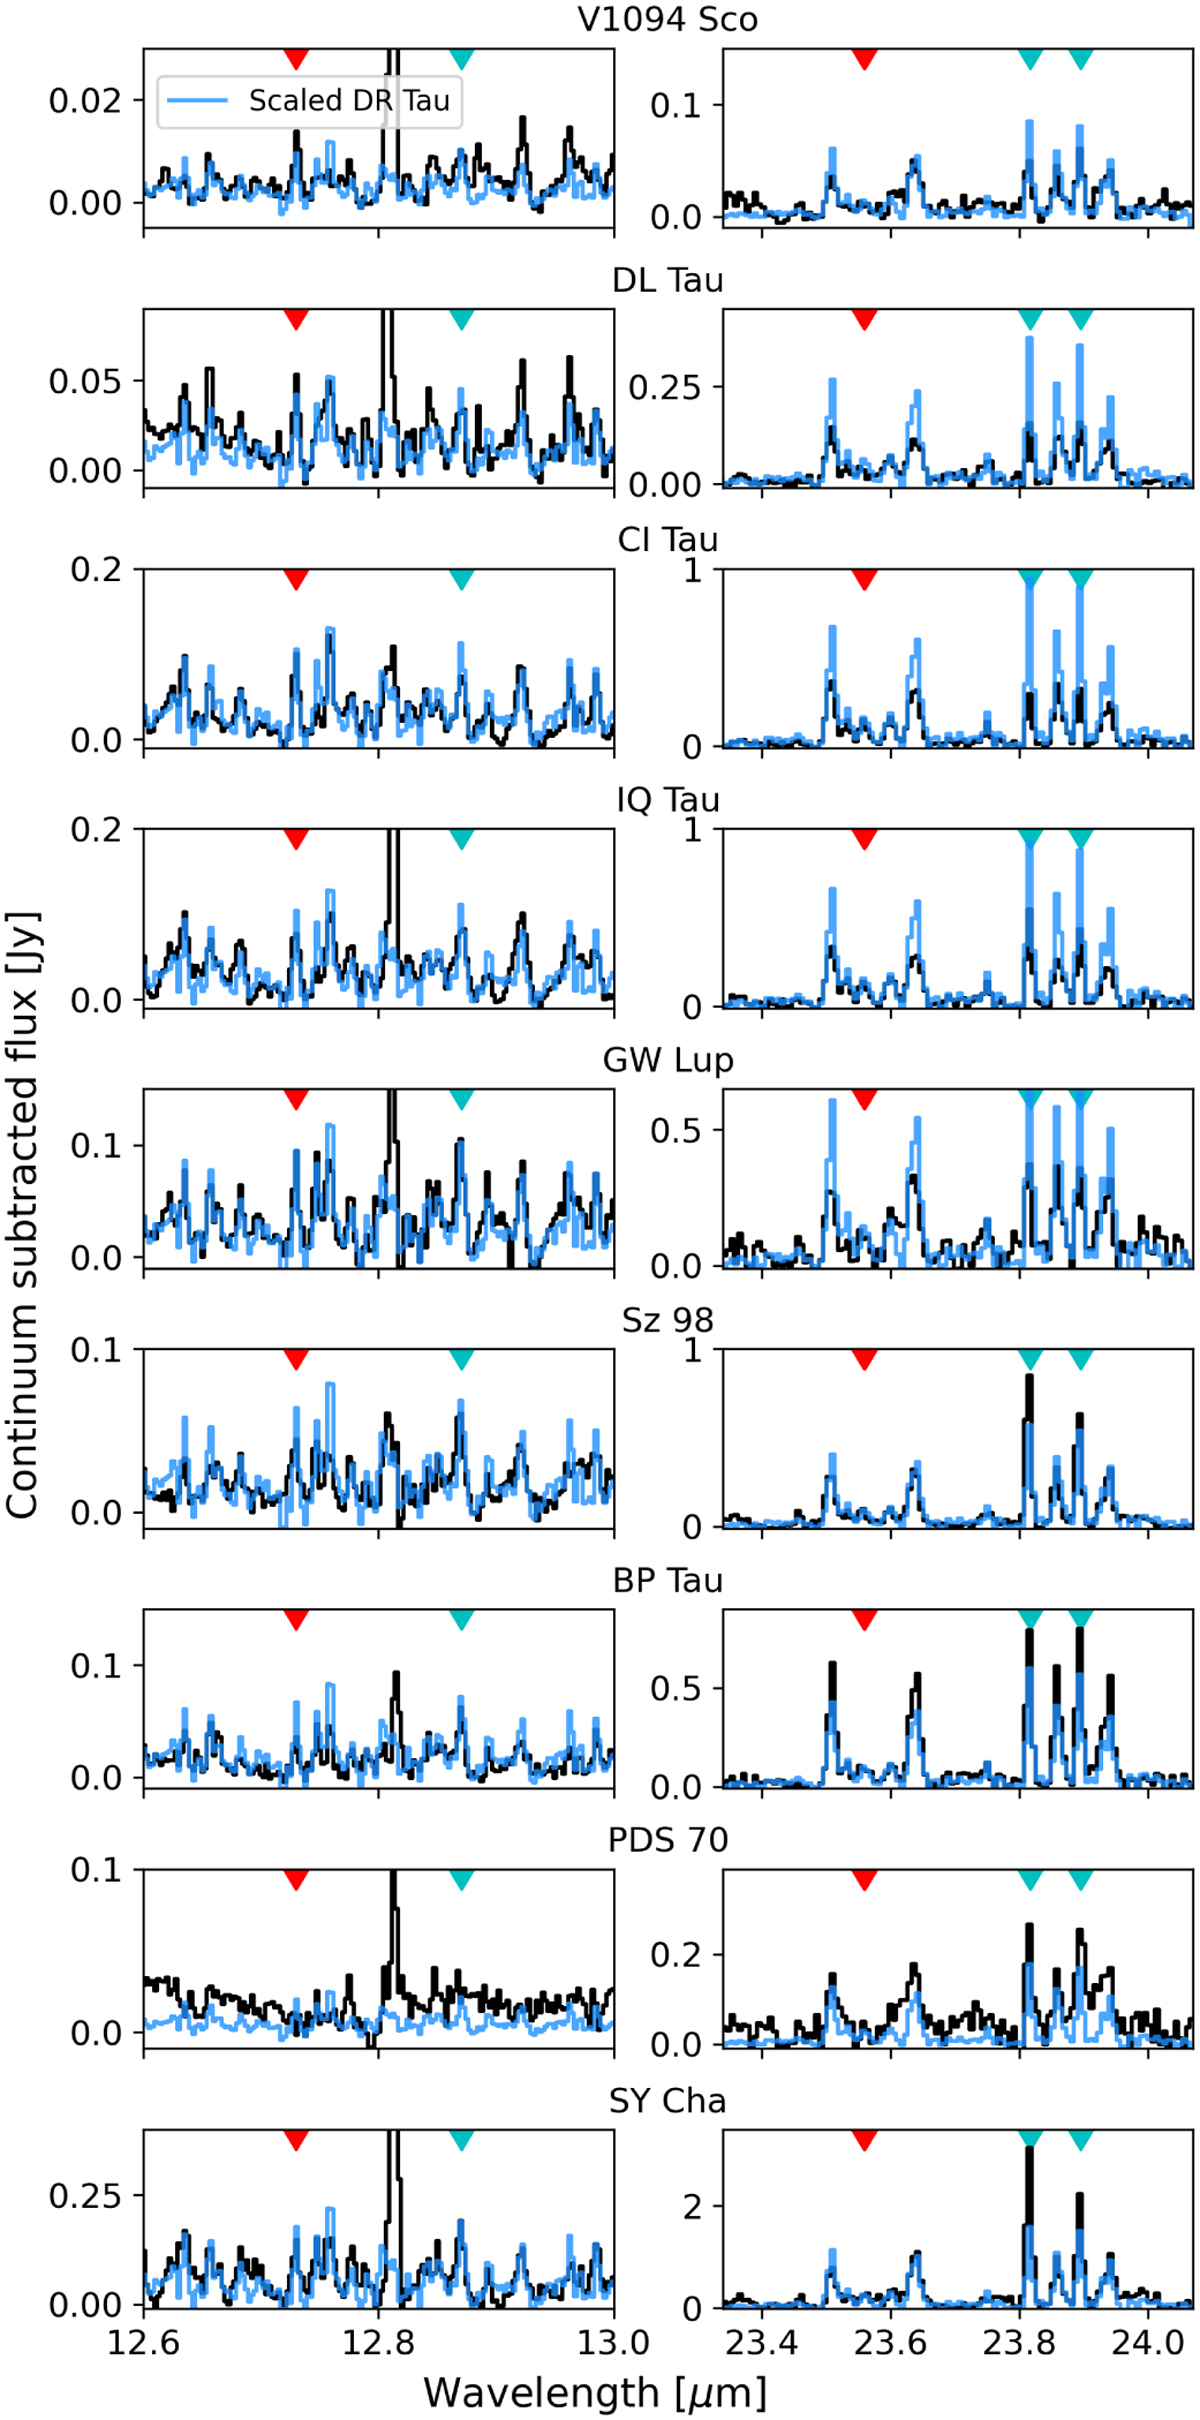
Comparison of warm (indicated by the red triangle) and cold (indicated by the blue triangle) H2O lines between DR Tau rescaled to the line strength of the other discs (blue line), and the emission from the discs themselves (black line).
Current usage metrics show cumulative count of Article Views (full-text article views including HTML views, PDF and ePub downloads, according to the available data) and Abstracts Views on Vision4Press platform.
Data correspond to usage on the plateform after 2015. The current usage metrics is available 48-96 hours after online publication and is updated daily on week days.
Initial download of the metrics may take a while.