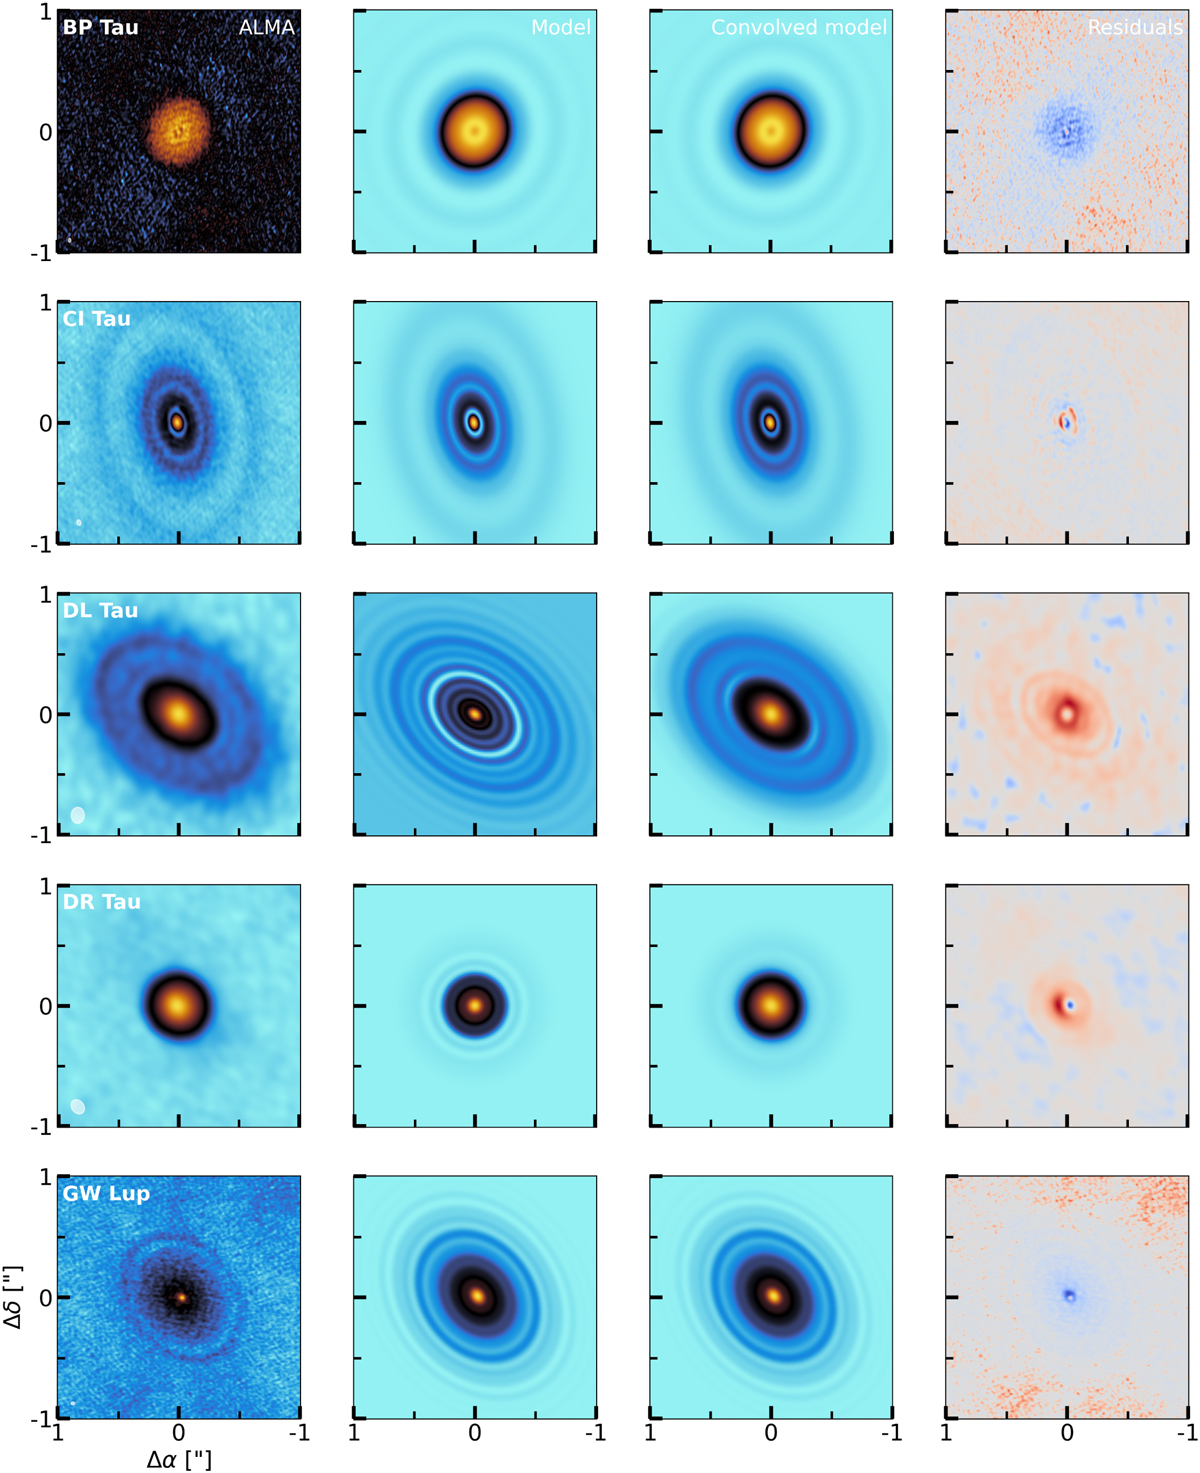
Fig. C.3
Download original image
Comparison between the ALMA image (first column), the model image (second column), the convolved model (third column), and the residuals (final column). All images, except the residuals, are shown with an arcsinh-stretch colourmap. The residuals are taken by subtracting the convolved model image off the ALMA image. Here, red residuals indicate more flux in the ALMA image, whereas blue residuals indicate more flux in the convolved model image.
Current usage metrics show cumulative count of Article Views (full-text article views including HTML views, PDF and ePub downloads, according to the available data) and Abstracts Views on Vision4Press platform.
Data correspond to usage on the plateform after 2015. The current usage metrics is available 48-96 hours after online publication and is updated daily on week days.
Initial download of the metrics may take a while.