Fig. 3.
Download original image
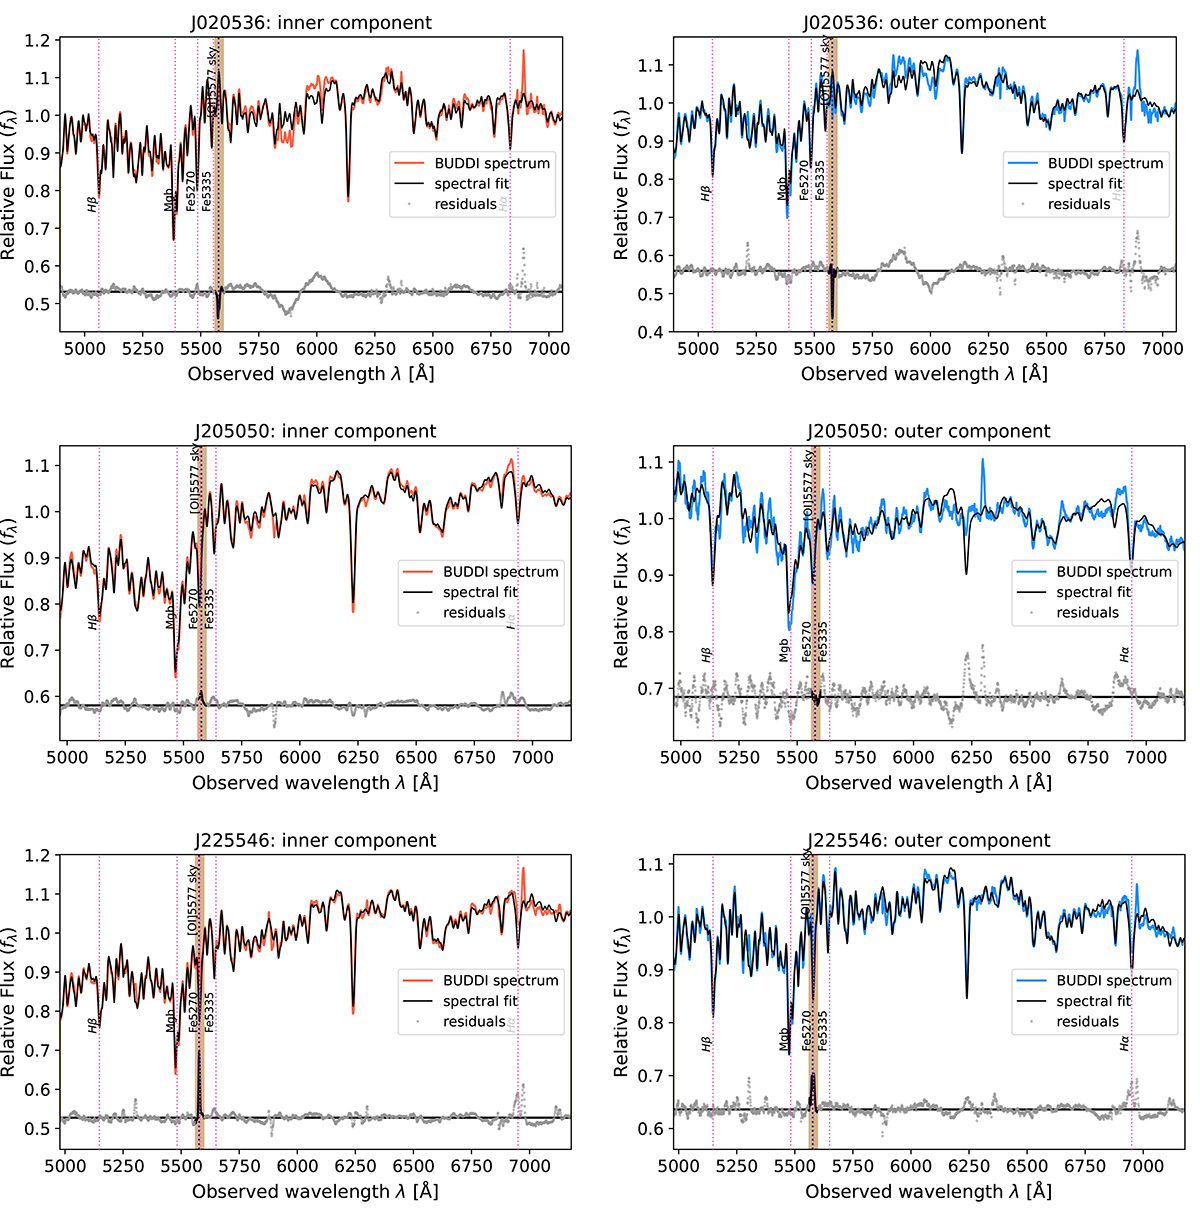
pPXF fits to the inner and outer component spectra derived from BUDDI. The component spectra are shown in red and blue for the inner and outer components, respectively, while the best spectral fits are shown in black. The grey points show the residuals, defined as the difference between the spectrum and the best fit. The brown stripe marks the location of the [OI] sky line, which is masked out during the fits.
Current usage metrics show cumulative count of Article Views (full-text article views including HTML views, PDF and ePub downloads, according to the available data) and Abstracts Views on Vision4Press platform.
Data correspond to usage on the plateform after 2015. The current usage metrics is available 48-96 hours after online publication and is updated daily on week days.
Initial download of the metrics may take a while.