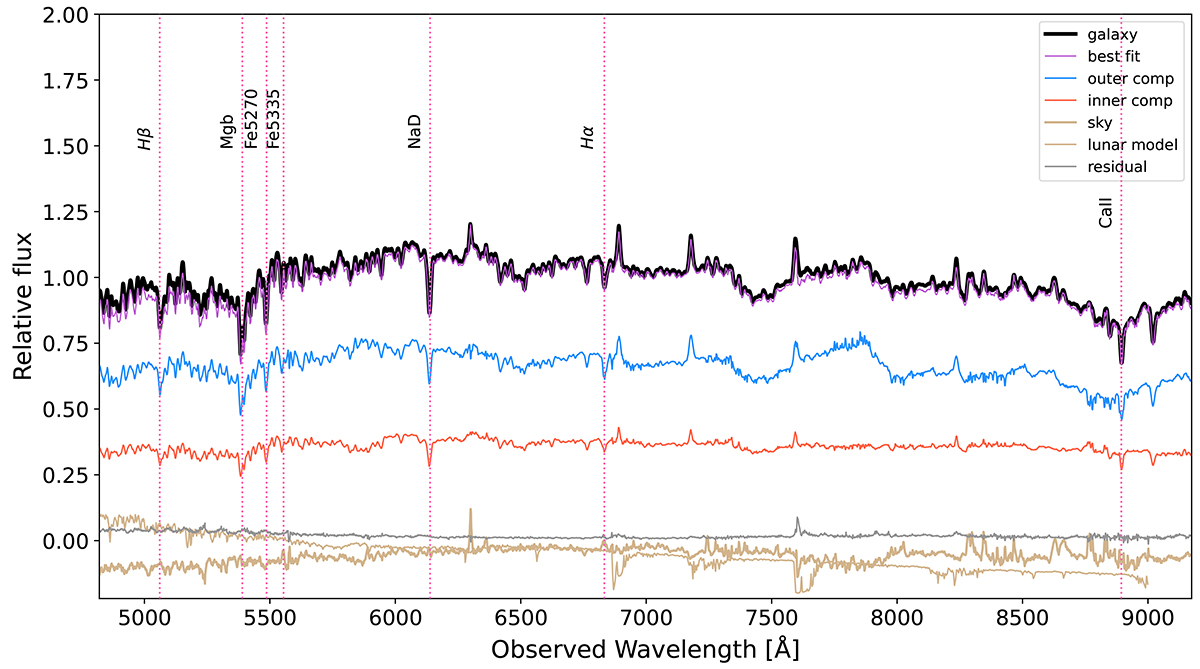
Fig. 2.
Download original image
Decomposed spectra of the different components in J020536 extracted by BUDDI, for the MUSE wavelength range from the optical to near-infrared. The galaxy spectrum integrated directly from the datacube is shown in black. The spectra of the inner component and outer component are displayed in red and blue, respectively, while the thick brown curve represents the sky spectrum from BUDDI. The scattered moonlight modelled by SkyCalc is shown by the thin brown curve, which has been arbitrarily scaled to match the flux scale of the normalised galaxy spectrum. The best fit model is represented by the purple spectrum, which includes the contributions of the inner and outer components, as well as the sky component. The residual flux of the best fit spectrum to the observed galaxy spectrum is displayed in grey. The dotted pink lines mark the wavelength positions of several important spectral features that are indicators of stellar age and metallicity.
Current usage metrics show cumulative count of Article Views (full-text article views including HTML views, PDF and ePub downloads, according to the available data) and Abstracts Views on Vision4Press platform.
Data correspond to usage on the plateform after 2015. The current usage metrics is available 48-96 hours after online publication and is updated daily on week days.
Initial download of the metrics may take a while.