Fig. 1.
Download original image
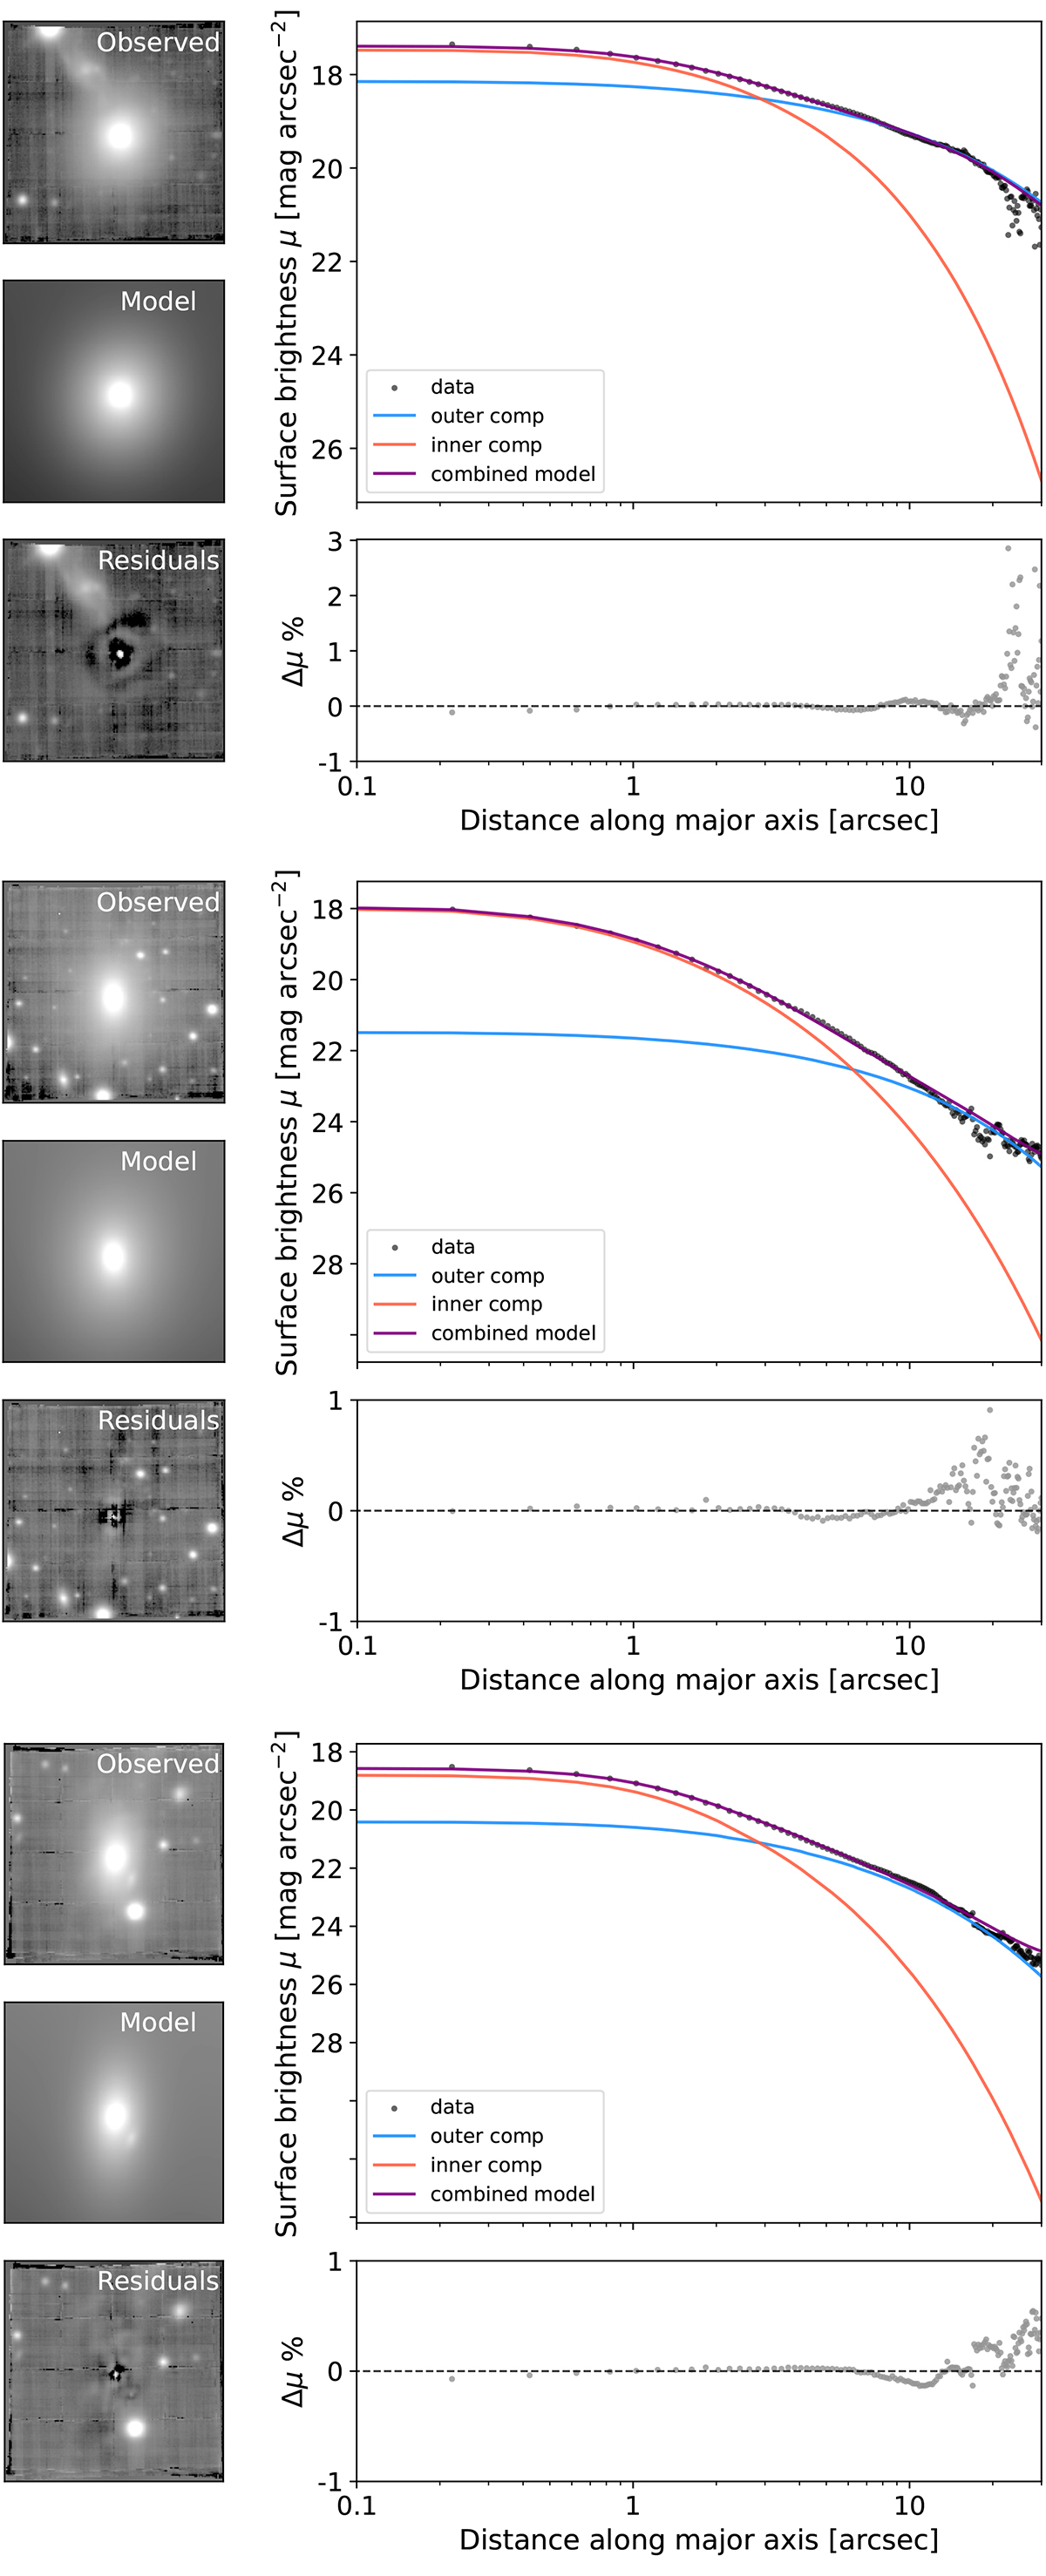
Fit to the median-stacked white-light image of the three ellipticals, J020536, J205050, and J225546, from top to bottom. Left column: Observed input image, best-fit model, and residual image. The images have all been scaled to the same flux for comparison. Upper right panel: 1D light profile of the galaxy for the white-light image along the major axis (black points), the Sérsic profiles of the inner (red line) and outer (blue line) components and the combined model (purple line). Lower right panel: Residuals (in percent) of the 1D data points and model as a function of distance along the major axis.
Current usage metrics show cumulative count of Article Views (full-text article views including HTML views, PDF and ePub downloads, according to the available data) and Abstracts Views on Vision4Press platform.
Data correspond to usage on the plateform after 2015. The current usage metrics is available 48-96 hours after online publication and is updated daily on week days.
Initial download of the metrics may take a while.