Open Access
Fig. 8.
Download original image
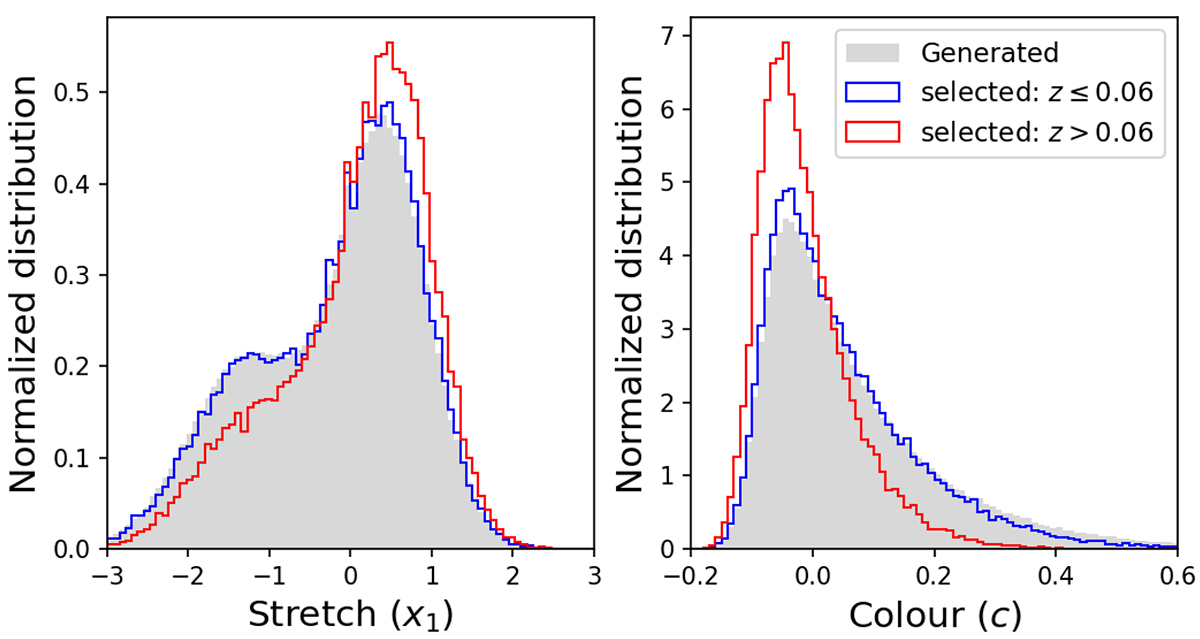
Comparison of the stretch (left plot) and colour (right plot) input distributions before (filled grey histograms) and after all selection cuts (open histogram) for lower (z ≤ 0.06, open blue histogram) and higher redshifts (z > 0.06, open red histogram).
Current usage metrics show cumulative count of Article Views (full-text article views including HTML views, PDF and ePub downloads, according to the available data) and Abstracts Views on Vision4Press platform.
Data correspond to usage on the plateform after 2015. The current usage metrics is available 48-96 hours after online publication and is updated daily on week days.
Initial download of the metrics may take a while.