Open Access
Fig. 7.
Download original image
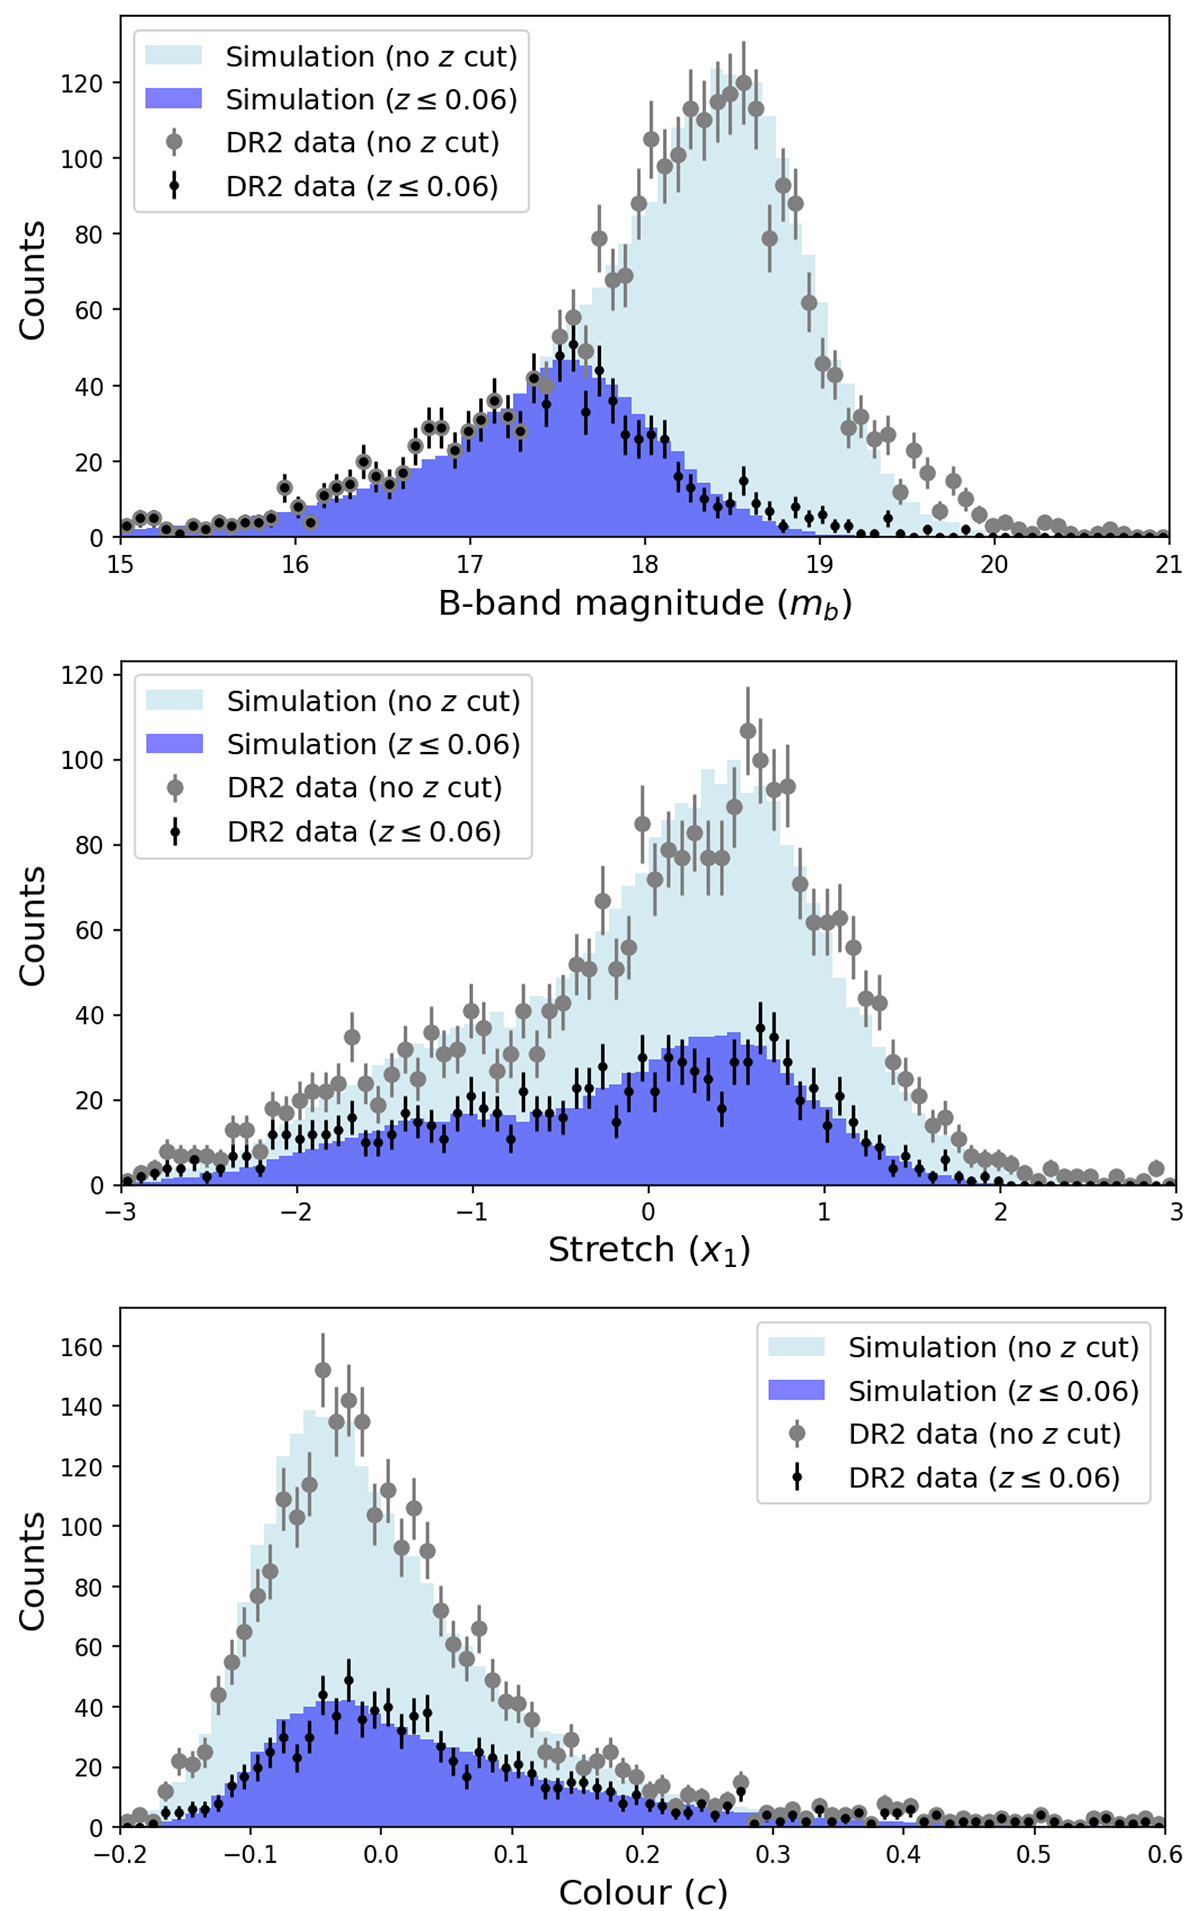
Comparison of DR2 SALT2 parameters (points with error bars), mb (upper plot), x1 (middle plot), and c (lower plot), with the skysurvey SNe Ia simulation after the light-curve fit (histograms) without a redshift cut (grey points and light blue histogram) and for z ≤ 0.06 (smaller black points and blue histogram).
Current usage metrics show cumulative count of Article Views (full-text article views including HTML views, PDF and ePub downloads, according to the available data) and Abstracts Views on Vision4Press platform.
Data correspond to usage on the plateform after 2015. The current usage metrics is available 48-96 hours after online publication and is updated daily on week days.
Initial download of the metrics may take a while.